Unpacking the NBA Conference Semifinals: How Bettors Are Building Their SGPs
Blog
May 21, 2025

Unpacking the NBA Conference Semifinals: How Bettors Are Building Their SGPs
In this article, we break down the latest trends in SGP betting during the semifinals - analyzing overall market popularity, how bettors structure their parlay legs, and which betting markets are drawing the most attention. From player props to total points and beyond, we take a closer look at what today’s basketball bettors are prioritizing when building their slips.
SGP Business Mix and Most Popular Markets
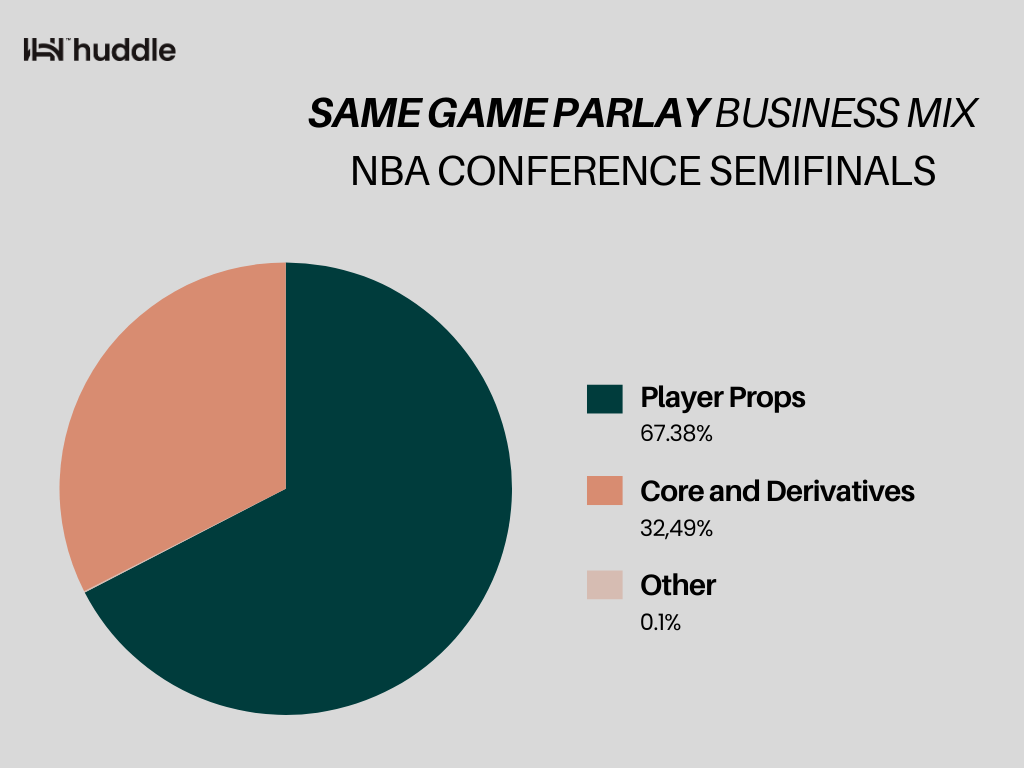
This data reveals a significant skew toward Player Props, which accounted for a dominant 67.38% of all SGP leg selections.
This overwhelming majority underscores a strong and growing bettor inclination to focus on individual player performances rather than broader team-based outcomes. Bettors appear more interested in granular outcomes like points, rebounds, or assists by specific players - than in traditional “Core and Derivatives” markets (such as spreads, totals, or team totals), which made up only 32.49% of selections.
The percentage of live bets placed through Bet Builder during the NBA playoffs reached 20.44%, highlighting a growing interest in real-time, customizable betting experiences among NBA fans. This trend underscores the importance of offering dynamic and flexible betting options to engage users during high-stakes games.
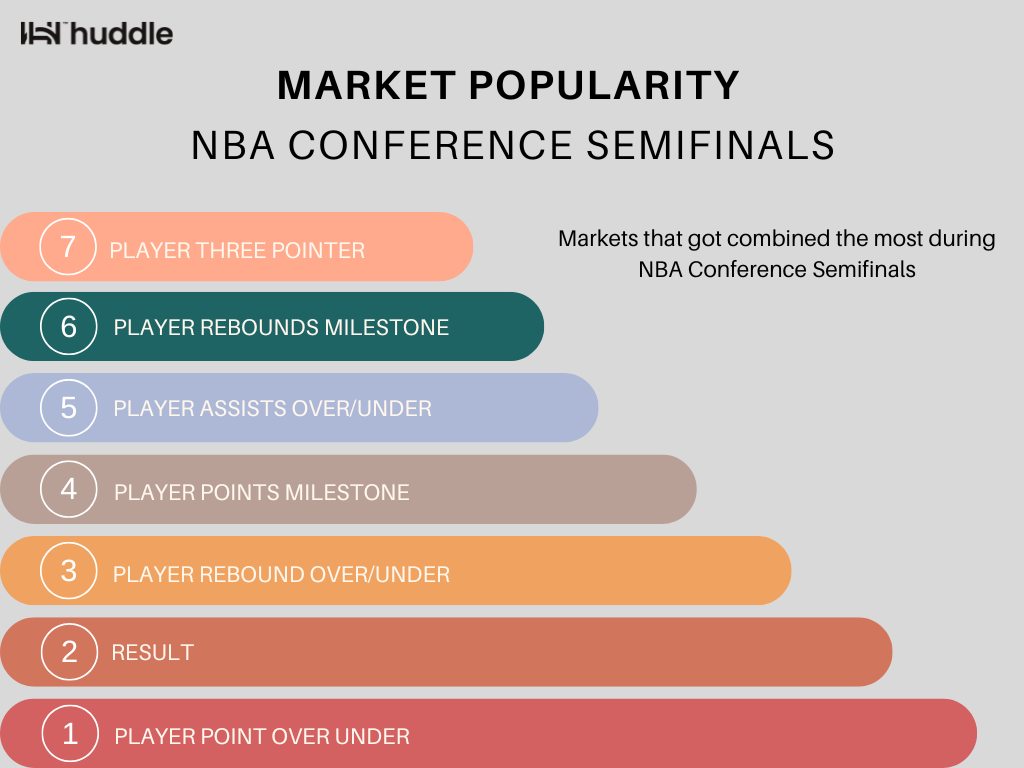
This chart takes a more granular look into SGP activity during the NBA Conference Semifinals by highlighting the specific markets bettors combined most frequently.
Interestingly, milestone markets like Player Points and Rebounds Milestones also rank high, indicating bettors’ interest in tracking standout individual achievements. Even niche options like Player Three Pointers made the top seven, reinforcing the growing appetite for detailed, stat-driven wagers over traditional team outcomes.
Bet Builder Size Distribution
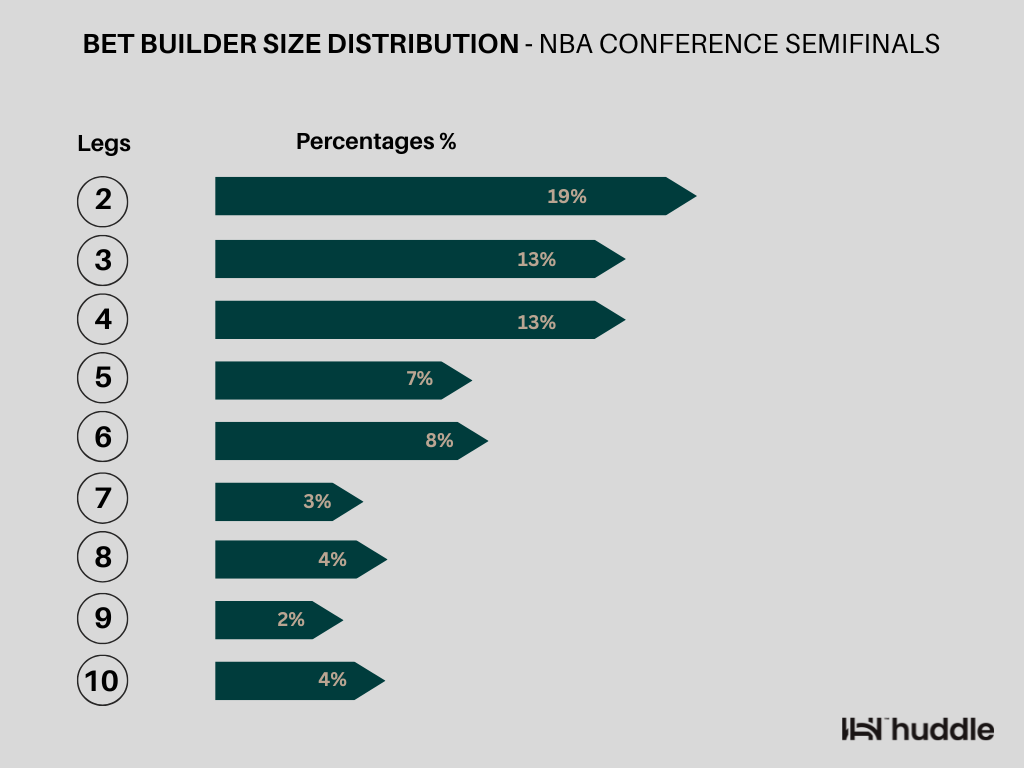
This graph shows the Bet Builder Size Distribution during the NBA Conference Semifinals, offering insight into how many legs bettors typically included in their Same Game Parlays.
Key takeaways:
- 2-leg parlays were the most common, accounting for 19% of all bet slips. This indicates a clear preference for simplicity and a higher probability of success.
- 3-leg and 4-leg parlays were tied at 13% each, showing that many bettors are comfortable adding moderate complexity in pursuit of slightly higher payouts.
- The share steadily declines as the number of legs increases, with 5 to 10-leg parlays making up smaller portions of the total.
Subscribe below and get the latest straight to your inbox