NBA Insights: How Huddle’s Superior Uptime and Pricing Precision Drove Operator Performance
Blog
May 12, 2025
NBA Insights: How Huddle’s Superior Uptime and Pricing Precision Drove Operator Performance
As the NBA season heats up, so does the demand for reliable, real-time betting experiences. At Huddle, we’ve been closely tracking our performance across last week’s games, paying particular attention to uptime and market-making accuracy. In this latest issue of our By The Numbers series, we dive into the impact of a stable and responsive infrastructure - especially when it matters most.
Huddle’s reliable technology ensures uninterrupted access to odds and live betting opportunities, directly influencing customer engagement and, ultimately, revenue. And during the critical moments of the NBA season, this reliability becomes a game-changer.
We also took a deeper look into how often a Tier 1 operator aligned their pricing with Huddle’s.
Uptime Comparison: Huddle vs The Market
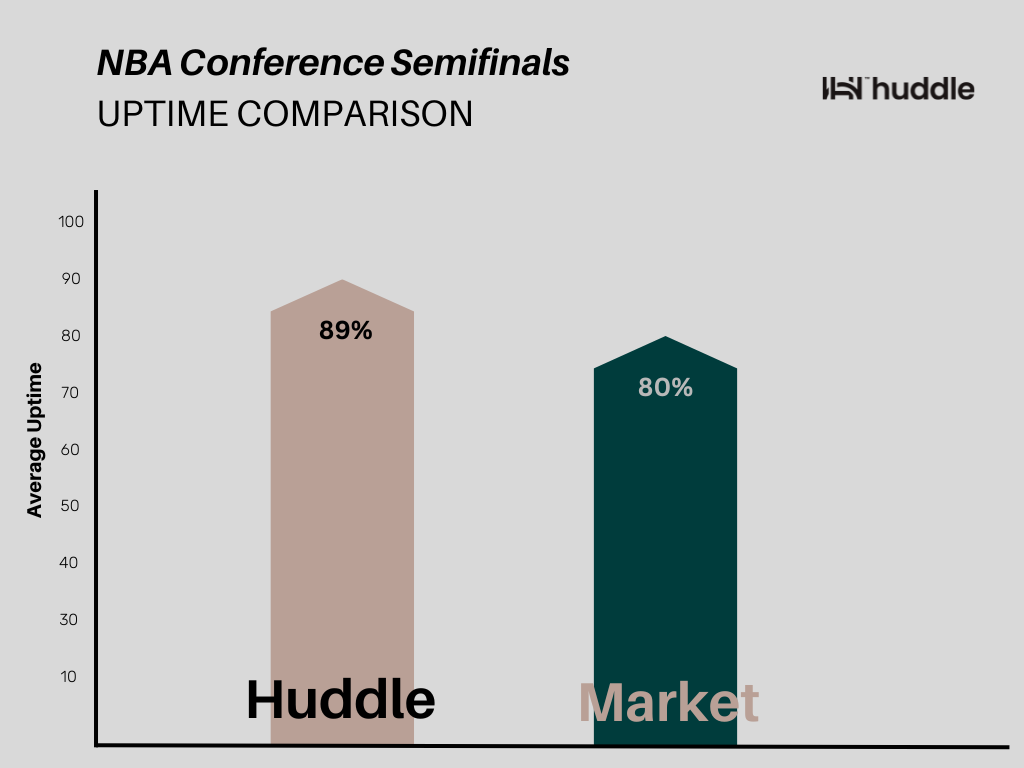
The bar chart highlights average uptime performance during the NBA Conference Semifinals (Games 1-3):
- Huddle: 89% uptime
- Market (Tier 1 Operator Benchmark): 80% uptime
This 9% gap in uptime is significant, especially during high-traffic, high-stakes sporting events like the NBA playoffs. In the context of sports betting, every percentage point of uptime can translate into:
- More opportunities to capture in-play bets
- Improved bettor satisfaction due to uninterrupted access
- Higher revenue generation, as users are less likely to face disruptions or look elsewhere
Huddle's superior uptime shows a clear competitive edge in infrastructure reliability, making it a preferred choice for operators aiming to deliver consistent, real-time betting experiences.
Market Making Comparison: Huddle vs The Market
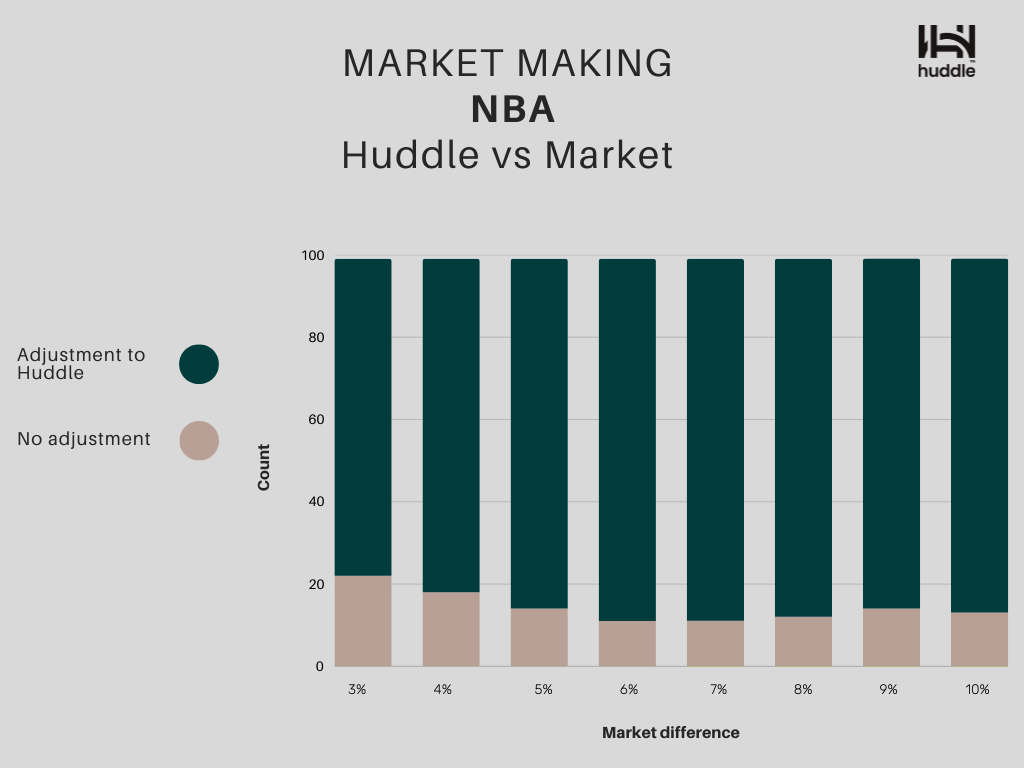
This chart illustrates how often the market (a Tier 1 operator) adjusted their prices to align with Huddle's, depending on the percentage difference in pricing.
Key insights:
- Consistent pattern across all price difference ranges (3%–10%): In every bracket, the majority of instances resulted in a market adjustment to Huddle’s price, typically around 80–85% of the time.
- Higher alignment with larger market differences: As the pricing discrepancy increases, the likelihood of the market adjusting to Huddle increases, showing that Huddle's prices are seen as more accurate or actionable, especially when variance is significant.
Subscribe to our Knowledge Hub and get the latest straight to your inbox