MLB 2024 Betting Insights: Top Markets, Popular Odds, and Creation Timelines
Blog
September 11, 2024

MLB 2024 Betting Insights: Top Markets, Popular Odds, and Creation Timelines
We conducted an in-depth analysis of betting numbers and trends throughout the MLB season. By examining data on market creation times, margin levels, and the popularity of various odds ranges for Bet Builders (Same Game Parlay), we've identified the most popular betting markets and the preferred odds ranges bettors favor for Bet Builder wagers.
Additionally, we explored the structure of Bet Builders, highlighting the percentage of bets that consist of varying numbers of legs.
Bet Builder Size Distribution
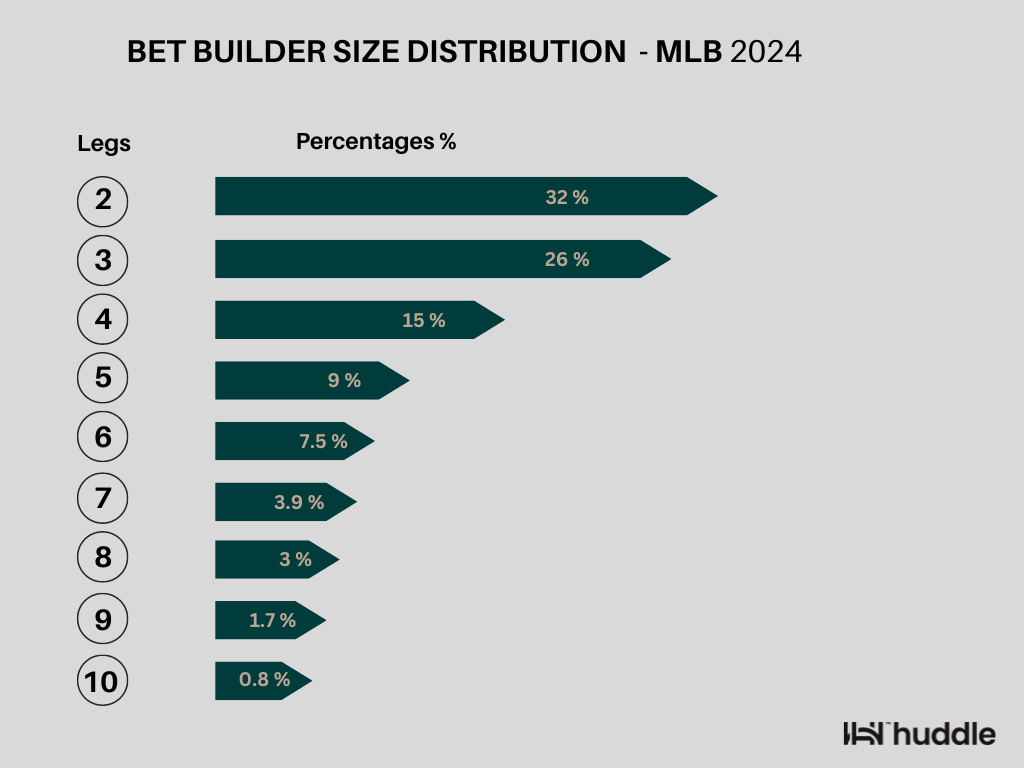
The graph illustrates the distribution of bet sizes in the Bet Builder for the 2024 MLB season, categorized by the number of legs included in each bet. Each "leg" in a bet represents a separate selection within a combined wager. The data indicates a strong preference among bettors for simpler bets:
- Two-leg bets are the most common, comprising 32% of all Bet Builder bets, suggesting that many bettors prefer combining just two selections.
- Three-leg bets follow closely, accounting for 26% of the bets, indicating a strong preference for slightly more complex bets.
- Four-leg bets make up 15%, and the frequency continues to decline as the number of legs increases, with five-leg bets at 9% and six-leg bets at 7.5%.
- Bets with seven to ten legs are less common, with each additional leg attracting fewer bettors. For instance, seven-leg bets account for 3.9%, decreasing to just 0.8% for ten-leg bets.
Market Popularity During MLB 2024
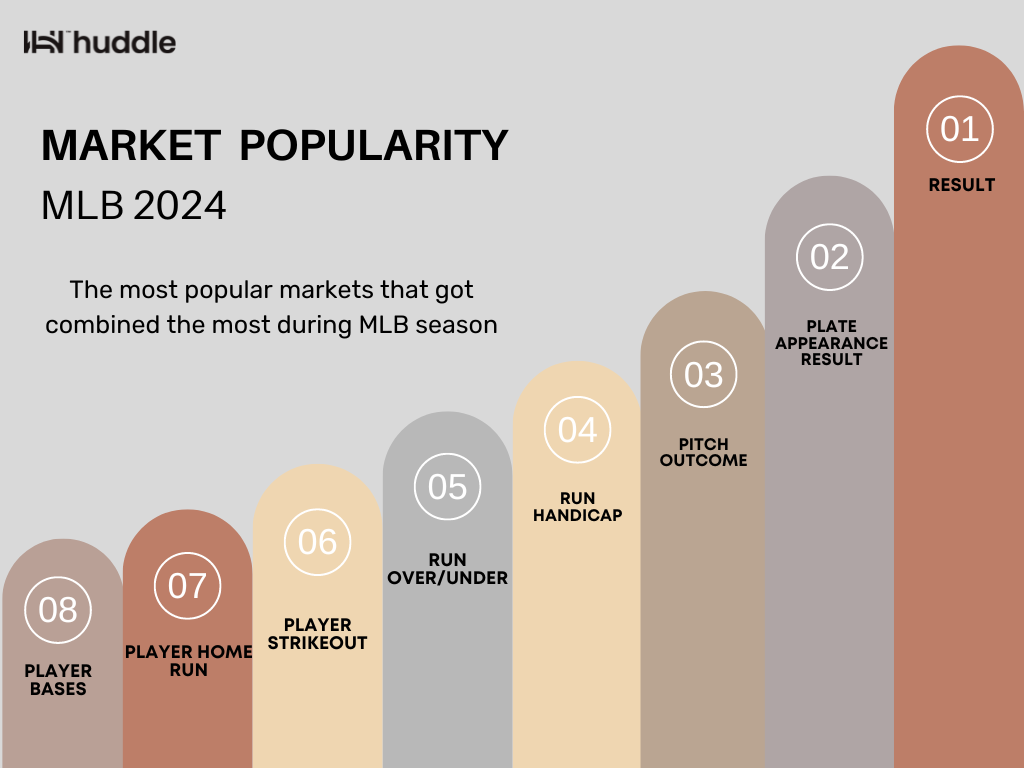
The graph displays the most popular betting markets for MLB 2024, ranked by how often they were combined in Bet Builders. It shows that the most common bets involved game results, individual plate appearance result, and pitch outcomes. Additional popular bets included run handicaps, over/under on total runs, and specific player performance metrics like strikeouts and home runs.
This indicates a wide range of betting interests among MLB fans, from general game outcomes to detailed player actions.
Price Distribution During MLB 2024
Key Points from the Graph:
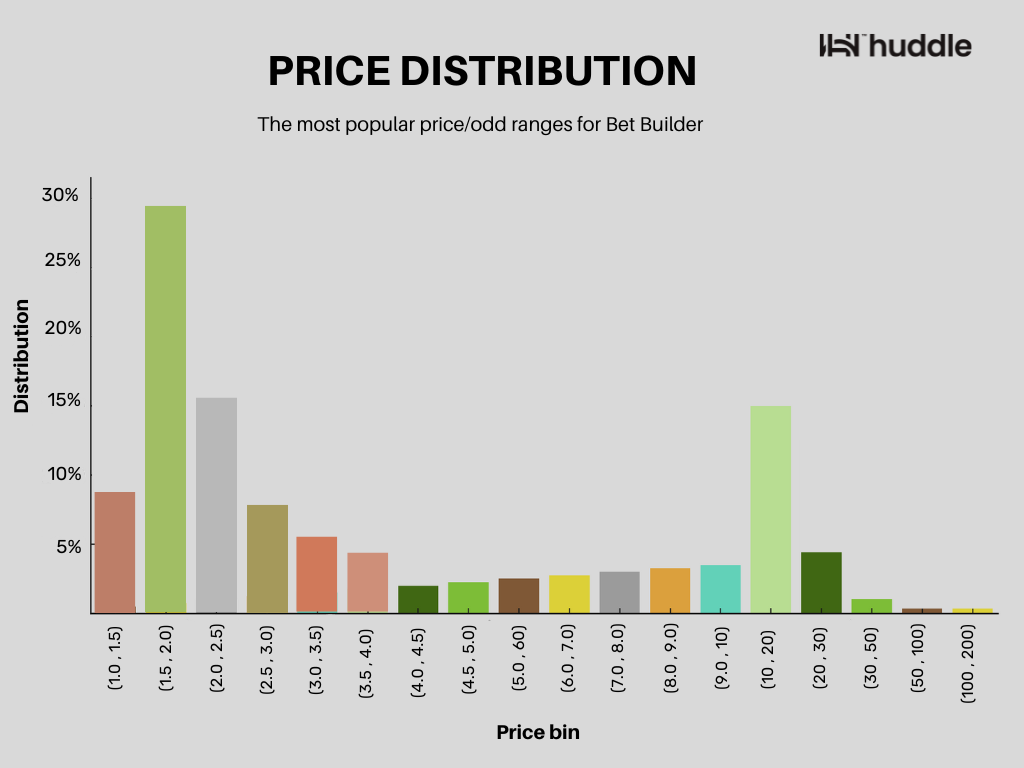
- Most Popular Range: The 1.5 to 2.0 odds range has the highest count, indicating it is the most popular among bettors.
- Secondary Peaks: Significant counts are also evident in the 1.0 to 1.5 and 3.0 to 3.5 ranges.
- Decreasing Frequency: As the odds increase from 4.0 upwards, the frequency of bets gradually decreases, showing that fewer bettors are willing to take on the higher risks associated with longer odds.
Time Distribution During MLB 2024
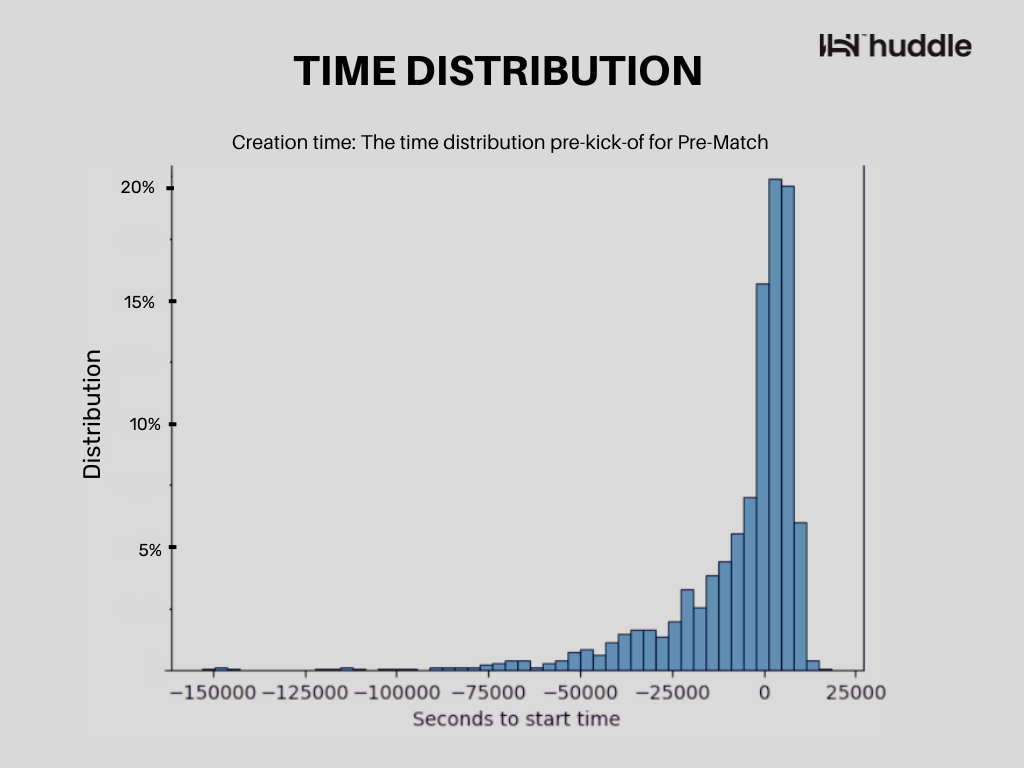
This histogram displays the acceptance time distribution for pre-match selections in seconds relative to the kick-off time. Here is a detailed analysis:
Overall Distribution:
- The x-axis represents the time in seconds before the kick-off, with negative values indicating time before the event starts.
- The y-axis represents the count of selections generated.
Key Observations:
- There is a noticeable increase in activity as the kick-off time approaches. This is evident from the spike in the number of selections generated close to zero seconds (kick-off).
- A significant number of selections are generated between 0 and -25,000 seconds (aprox. 7 hours before game starts)
- With the count peaking just before the event starts, this suggests that users are most active in making their selections closer to the match time.
Subscribe below and get the latest insights straight to your inbox!