By The Numbers: Huddle’s Uptime, Pricing Accuracy, and SGP Trends
Blog
June 4, 2025
By The Numbers: Huddle’s Uptime, Pricing Accuracy, and SGP Trends
In this edition of By The Numbers, we explore how a stable, responsive infrastructure can make all the difference—especially when the stakes are high.
Huddle’s robust technology consistently delivers uninterrupted access to odds and live betting options, driving both customer engagement and revenue. This edge becomes even more crucial during high-pressure periods like the NBA Conference Finals. In a recent analysis, we compared our platform uptime with a leading Tier 1 operators-and once again, Huddle came out ahead.
We also examined how frequently that same Tier 1 operator’s pricing aligned with Huddle’s pricing, providing insight into market efficiency and accuracy.
Finally, we broke down the business mix for NBA Same Game Parlays (SGP). A significant 72% of Same Game Parlay (SGP) bets came from Player Props, indicating a strong bettor preference for markets focused on individual player performance
Uptime Comparison: Huddle versus the Market
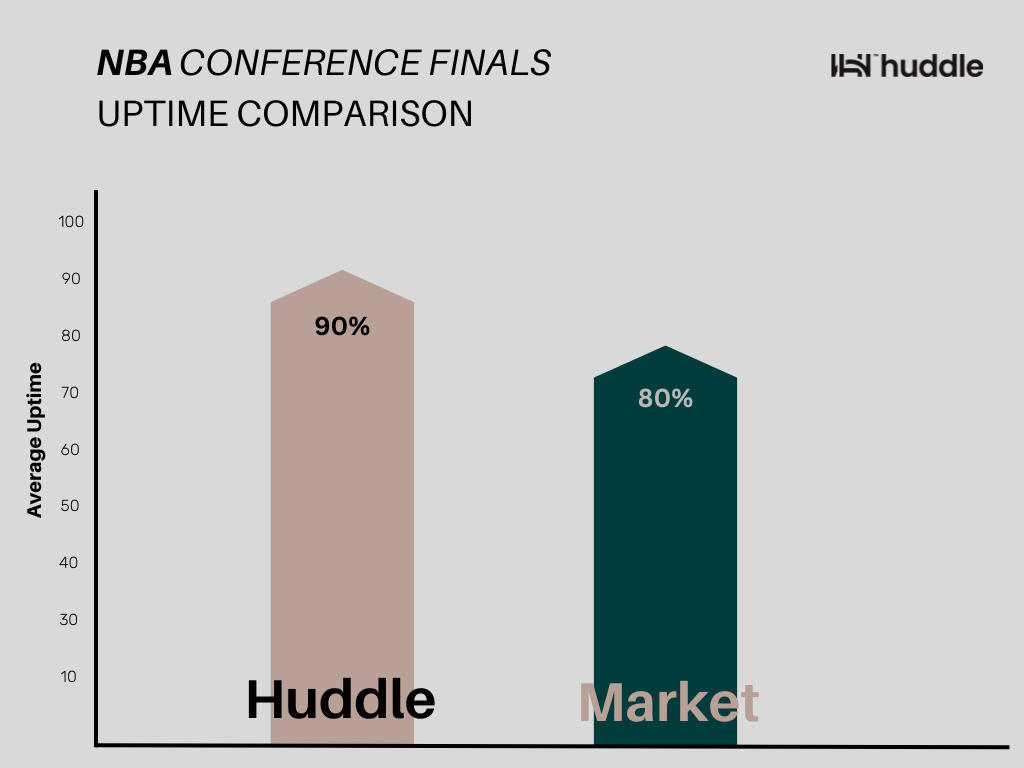
The bar chart highlights average uptime performance during the NBA Conference Finals:
- Huddle: 90% uptime
- Market (Tier 1 Operator Benchmark): 80% uptime
This 10% gap in uptime is significant, especially during high-traffic, high-stakes sporting events like the NBA playoffs. In the context of sports betting, every percentage point of uptime can translate into:
- More opportunities to capture in-play bets
- Improved bettor satisfaction due to uninterrupted access
- Higher revenue generation, as users are less likely to face disruptions or look elsewhere
Huddle's superior uptime shows a clear competitive edge in infrastructure reliability, making it a preferred choice for operators aiming to deliver consistent, real-time betting experiences.
Market Making: Huddle vs Market
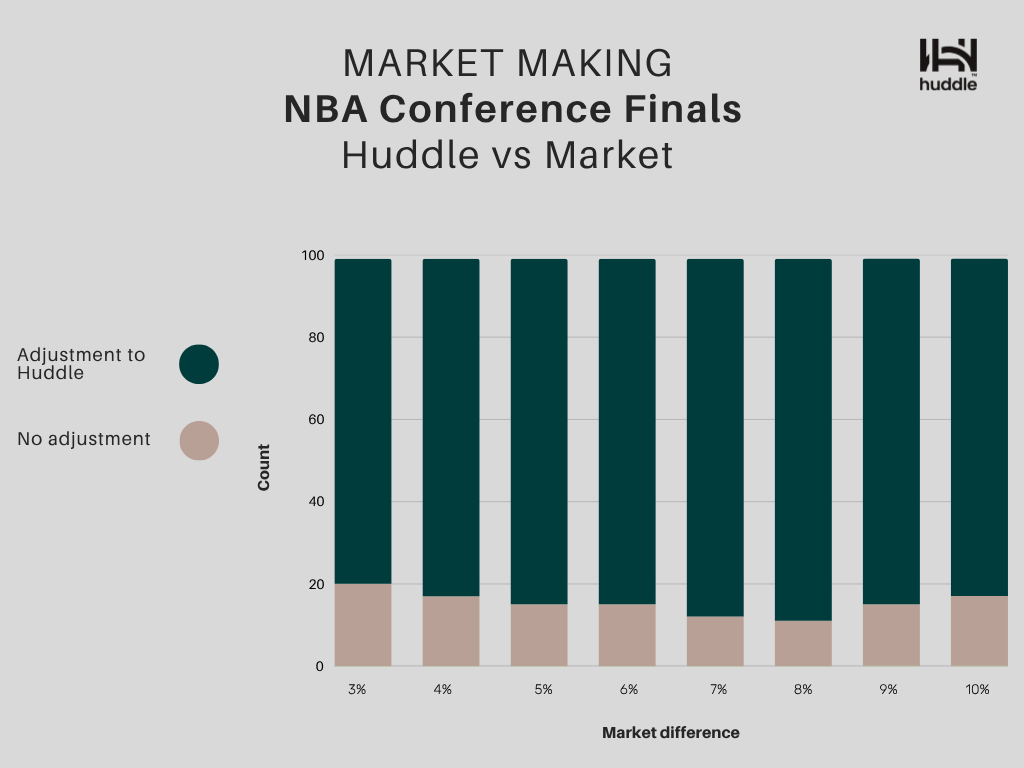
This chart illustrates how often the market (a Tier 1 operator) adjusted their prices to align with Huddle's, depending on the percentage difference in pricing.
Key insights:
- Consistent pattern across all price difference ranges (3%–10%): In every bracket, the majority of instances resulted in a market adjustment to Huddle’s price, typically over 80% of the time.
- Higher alignment with larger market differences: As the pricing discrepancy increases, the likelihood of the market adjusting to Huddle increases, showing that Huddle's prices are seen as more accurate, especially when variance is significant.
SGP Mix: Player Props Dominance
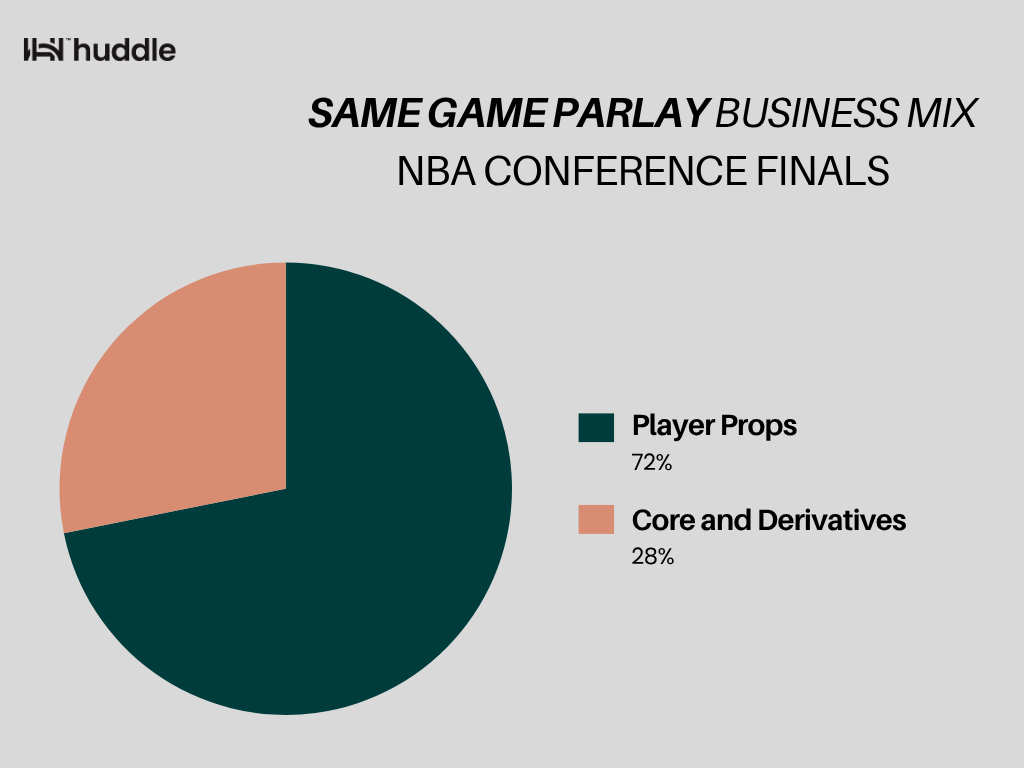
Key Takeaways:
- Dominance of Player Props:
A significant 72% of Same Game Parlay (SGP) bets came from Player Props, indicating a strong bettor preference for markets focused on individual player performance (e.g., points, rebounds, assists). This reflects a broader trend in the sports betting industry where personalized, performance-based markets are becoming more popular, especially during high-stakes games like the NBA Conference Finals.
- Core and Derivatives Underrepresented:
The remaining 28% came from traditional betting markets and derivatives (e.g., game outcomes, spreads, totals). While still important, these markets play a secondary role in SGP engagement during these events.
Percentage of live bets: 29.18%