By The Numbers: Huddle Performance During NBA Finals 2024
Blog
July 1, 2024
By The Numbers: Huddle Performance During NBA Finals 2024
The NBA season has come to a thrilling end with an exciting finals series. As we reflect on the championship games, we are excited to share our own performance during this period.
Here's how we delivered, from our competitive pricing to maintaining exceptional uptime, ensuring our service was as reliable and impressive as the action on the court.
Pricing: Huddle vs. Market
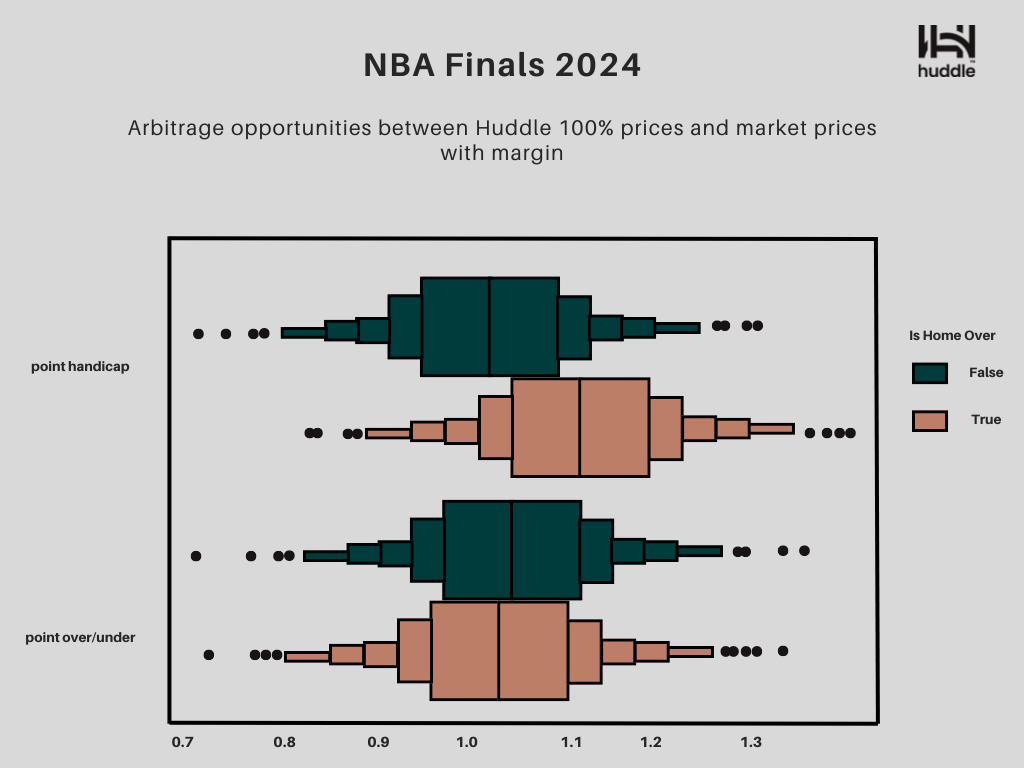
We showcased Huddle's superior prices during NBA Finals by describing the discrepancy between Huddle and market (tier 1 operator) prices for NBA in play markets "Total points" and "Spread", in particular arbitrage opportunities.
For each data point in Huddle, we looked for the closest market (tier 1 operator) price in time, considering only prices maximum 120 seconds apart and we listed Huddle's true probability and market observed price.
To explore arbitrage opportunities, we calculated the total book obtained combining Huddle's Home/Over side 100% price and Market (tier 1 operator) Away/Under side price with margin (and conversely). We then described the distribution of these total books, observing the frequency of arbitrages (i.e. "lower than 1" tail of the books distribution).
Conclusion:
- Even without adding margin, Huddle in play prices offer arbitrage with the market only the minority of the times (27.2%).
- By adding a standard 6% book (splitted 50/50) the chance of an arbitrage falls to 15%.
- The behavior doesn't change by side or market.
These numbers show Huddle's unique pricing while not being far off from the market at the same time.
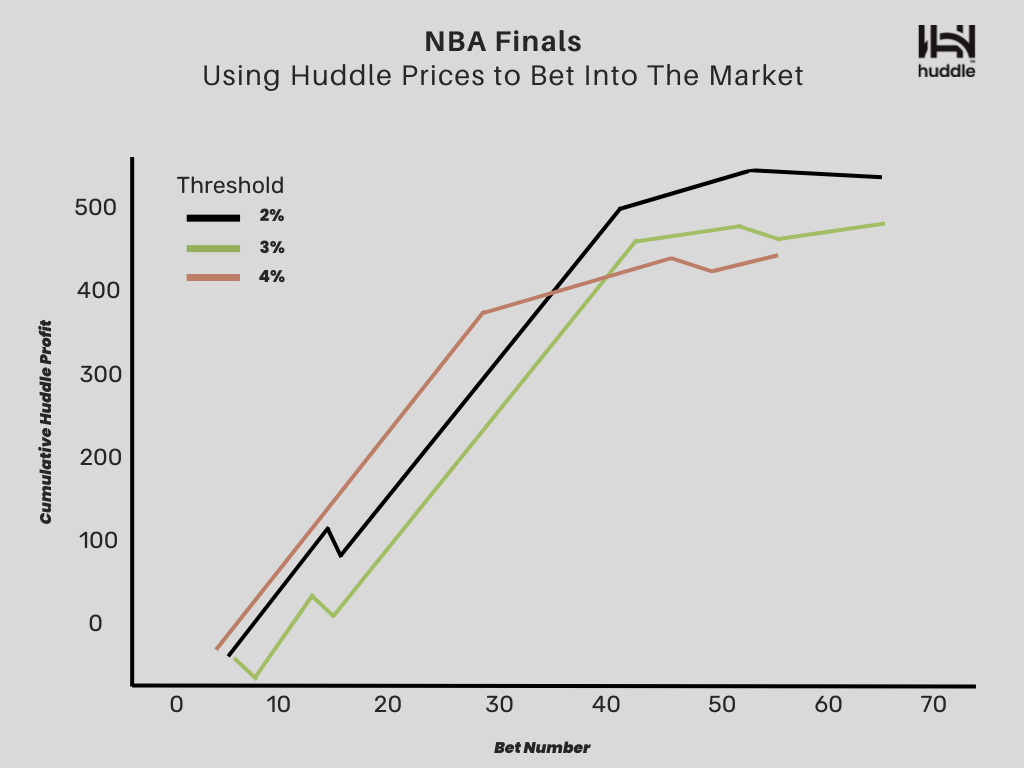
The graph below shows the potential profit Huddle could have garnered had they opted to utilize their model for betting directly into the market, rather than solely pricing probabilities for their partners who use them to accept bets during the Dallas Mavericks vs. Boston Celtics.
Each point on the graph shows a $10 bet where Huddle's model significantly differed from the market price. For example, if Huddle placed a $10 bet whenever their model deviated by more than 2% from the market, they would have made a profit of $455 in that game.
Huddle's model enhances pricing accuracy, enabling operators to boost their margins while safeguarding against sharp bettors. By leveraging advanced analytics, Huddle helps operators maintain competitive edges and ensure profitable operations
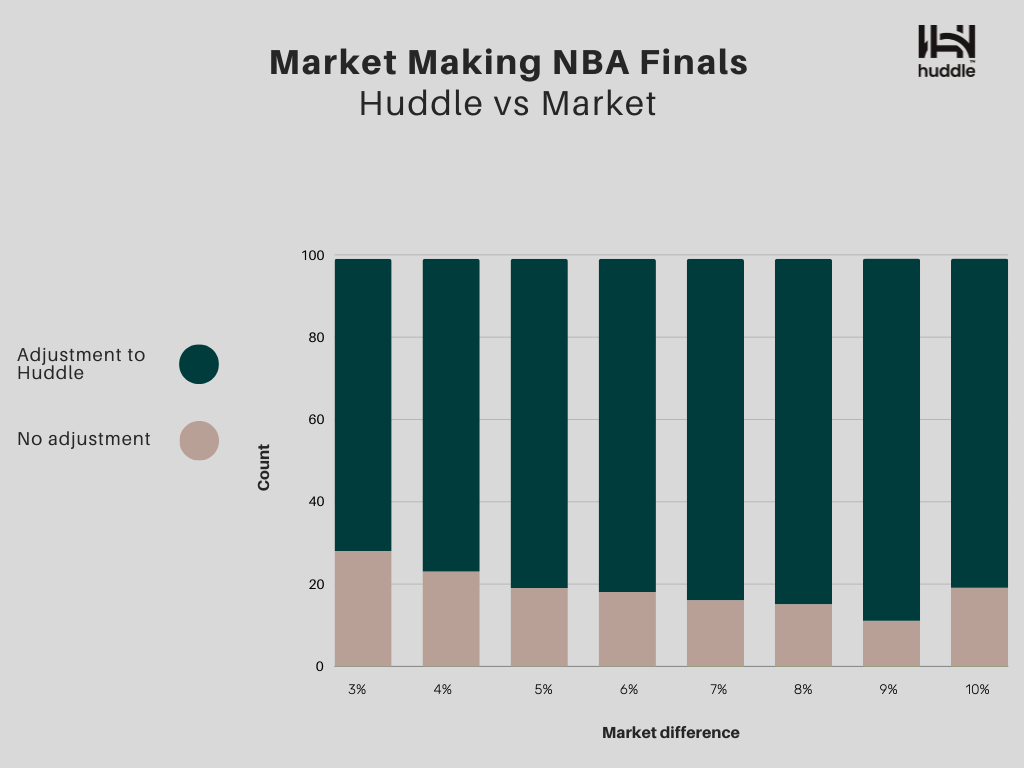
During the finals games, we analysed in how many instances the market (tier 1 operator) adjusted to Huddle prices.
For instance, on multiple occasions the Huddle prices differed from the market by 3%. Impressively, in 71% of these instances, the market adjusted to match Huddle's prices. This underscores Huddle's influence as a market leader in setting prices. The trend remained the same even when the pricing differences were larger - the market ultimately adjusted their prices to Huddle's prices, underscoring the our remarkable market-making prowess.
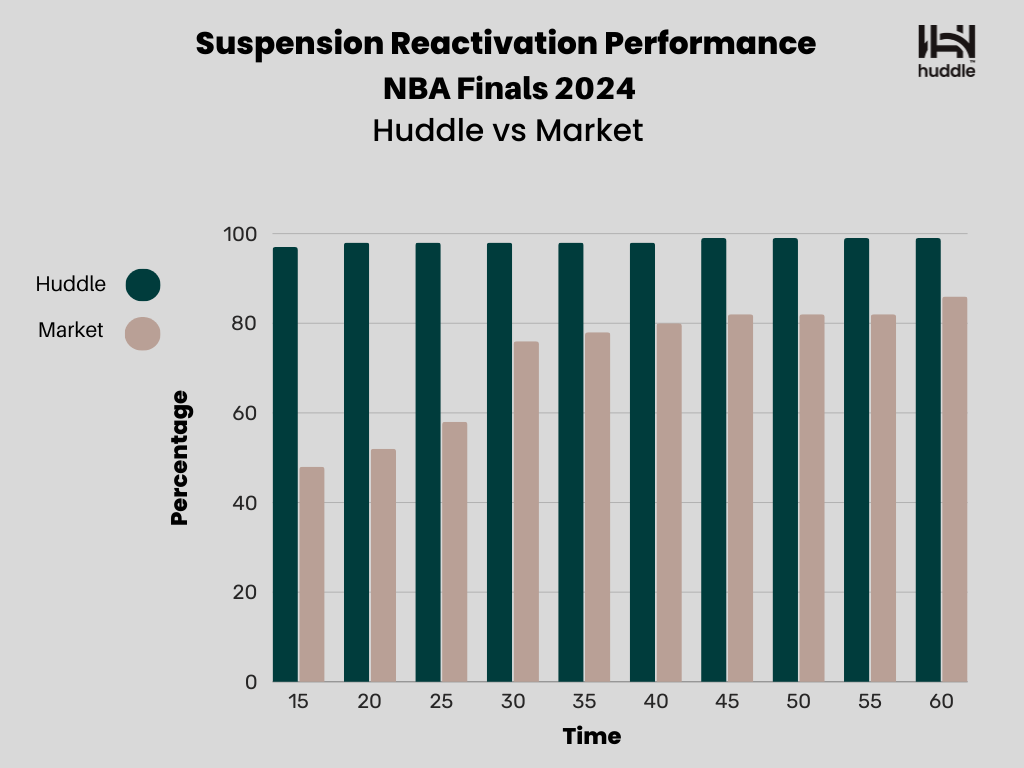
Uptime Performance During NBA Finals
Our data reveals an impressive achievement by Huddle: a remarkable 97% reactivation rate within just 15 seconds, far surpassing the market average of 48% during NBA Finals.
Over extended durations, we consistently outperform competitors with even higher reactivation rates. Quick market unsuspension and continuous availability are critical elements that we prioritize to ensure seamless services for our users.
Subscribe to our Knowledge Hub and get the latest straight to your inbox!