NBA Finals Betting Insights: Top Markets, Popular Odds, and Creation Timelines
Blog
June 24, 2024
NBA Finals Betting Insights: Top Markets, Popular Odds, and Creation Timelines
During NBA Finals we dived into betting numbers and trends. By analyzing data on market creation times, margin levels, and the popularity of various odds ranges for Bet Builders, we've identified the most popular betting markets and the preferred odds ranges of for Bet Builder among bettors.
Additionally, we explore the structure of Bet Builders, revealing the percentage of bets containing different numbers of legs.
Bet Builder Size Distribution
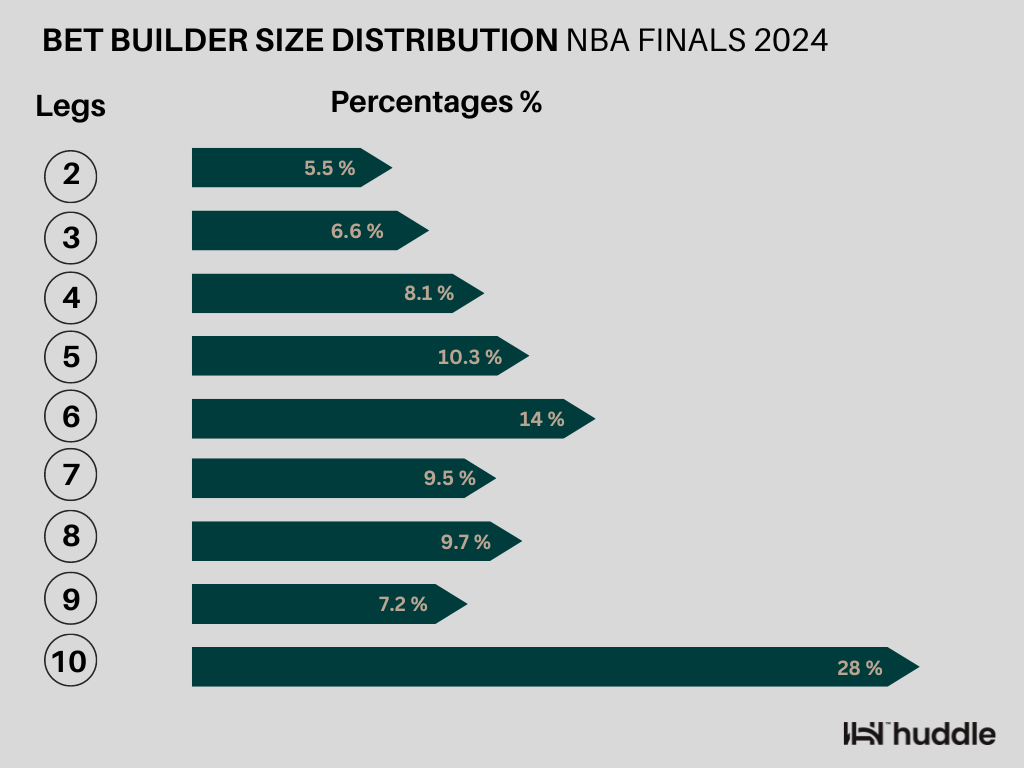
The graph illustrates the distribution of bet builder sizes for the NBA Finals 2024, measured in percentages for different numbers of legs. The majority of bettors (28%) prefer bet builders with 10 legs. Bet builders with 6 legs are the next most popular at 14%, followed by 5 legs at 10.3%, and 8 legs at 9.7%. Less popular are bet builders with 7 legs (9.5%), 4 legs (8.1%), 9 legs (7.2%), 3 legs (6.6%), and 2 legs (5.5%).
This data suggests a strong preference for larger, more complex bet builders among bettors during the NBA Finals.
Market Popularity During NBA Finals
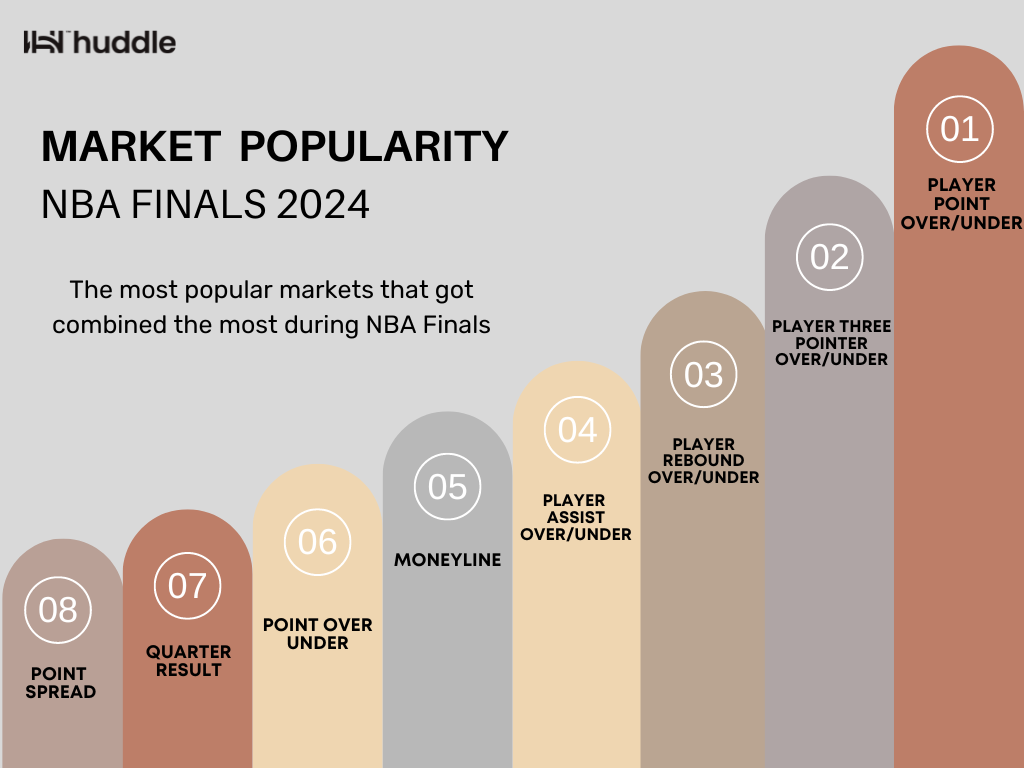
The graph depicts the popularity of different betting markets during the NBA Finals 2024, highlighting the most frequently combined markets in bet builder.
The top market is "Player Point Over/Under," indicating it was the most popular choice among bettors. Following closely are "Player Three Pointer Over/Under" and "Player Rebound Over/Under," ranking second and third respectively. "Player Assist Over/Under" takes the fourth spot, while "Moneyline" bets rank fifth. The "Point Over/Under" market is sixth, with "Quarter Result" in seventh place and "Spread" rounding out the list in eighth.
Analyzing the provided data alongside the top eight markets, several conclusions emerge about betting preferences during the NBA Finals 2024:
- Player-Specific Bets Dominate: Bets on individual player performance (points, three-pointers, rebounds, assists) are the most popular, indicating bettors' strong interest in player metrics over team or game outcomes.
- Half and Period Bets Are Less Popular: Bets on "Half Result," "Half Point Over/Under," and "Period Point Over/Under" are less favored, suggesting a preference for full-game or player-specific bets over segmented game outcomes.
- Team-Specific Bets Are Less Popular: Markets such as "Team Point Over/Under" and "Team Half Point Over/Under" rank lower, reinforcing the focus on individual players.
Price Distribution During NBA Finals
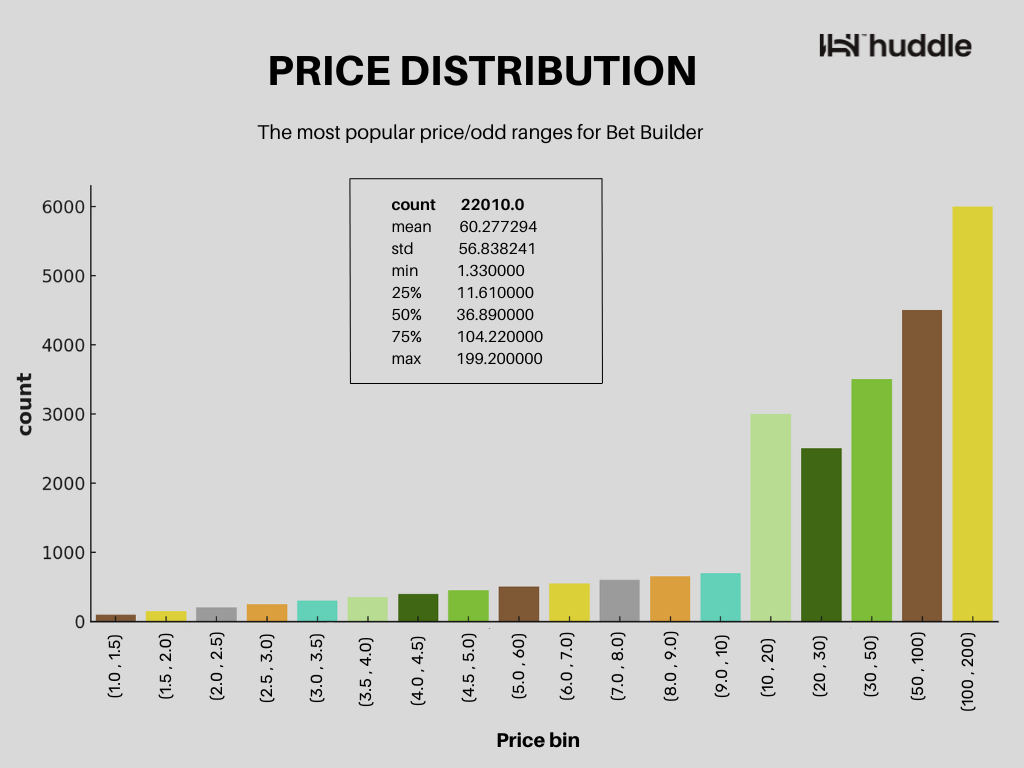
The graph shows the price distribution for Bet Builder bets during the NBA Finals 2024, segmented into various price bins. Here are the key insights:
- High Popularity for High Odds: The price bin (100.0 - 200.0) is the most popular, with the highest count of bets, followed by (50.0 - 100.0) and (30.0 - 50.0). This suggests bettors are more inclined towards placing bets with higher odds, potentially seeking higher payouts despite the increased risk.
- Moderate Popularity for Mid-Range Odds: The bins (20.0 - 30.0) and (10.0 - 20.0) also show significant popularity, indicating a fair number of bets are placed in this moderate price range.
- Lower Popularity for Low Odds: Bins ranging from (1.0 - 1.5) to (9.0 - 10.0) have considerably lower counts, indicating that bets with lower odds are less popular. Bettors seem less interested in safer bets with smaller potential payouts.
Time Distribution During NBA Finals
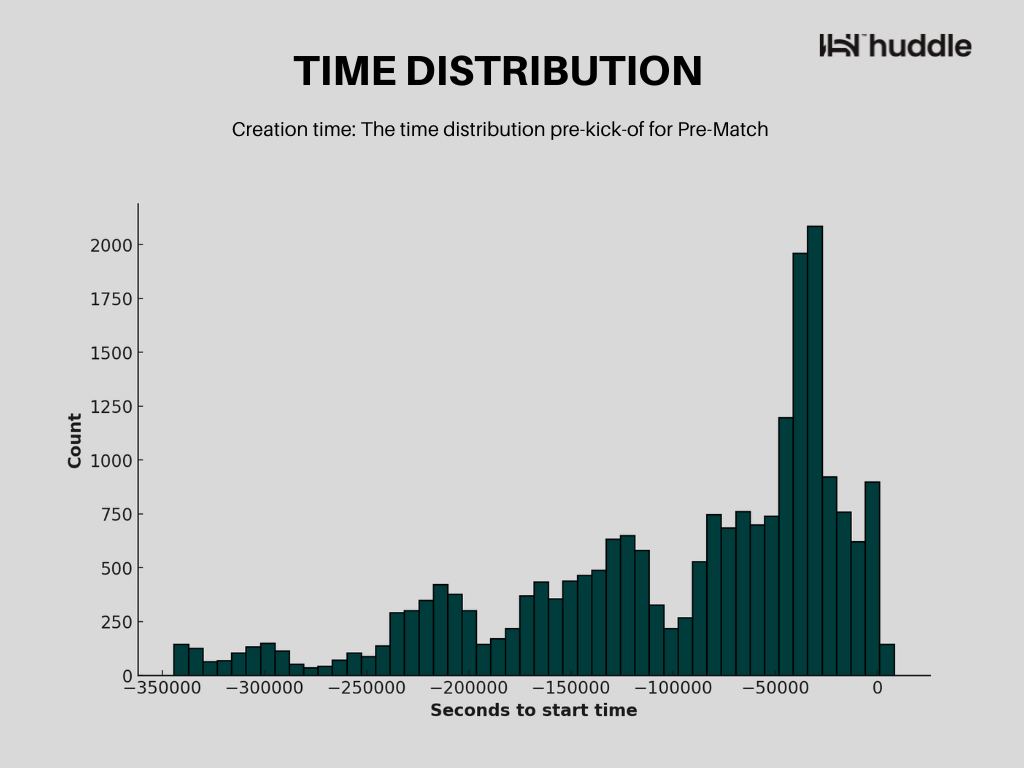
This histogram displays the acceptance time distribution for pre-match selections in seconds relative to the kick-off time. Here is a detailed analysis:
Overall Distribution:
- The x-axis represents the time in seconds before the kick-off, with negative values indicating time before the event starts.
- The y-axis represents the count of selections generated.
Key Observations:
- There is a noticeable increase in activity as the kick-off time approaches. This is evident from the spike in the number of selections generated close to zero seconds (kick-off).
- A significant number of selections are generated between 0 and -50,000 seconds (approximately within 14 hours before the match).
- The highest concentration of selections is seen in the range of -50,000 to 0 seconds, with the count peaking just before the event starts. This suggests that users are most active in making their selections closer to the match time.
Subscribe below and get the latest insights straight to your inbox!