By The Numbers: NBA Playoffs 2024, Conference Semifinals
Blog
May 22, 2024

By The Numbers: NBA Playoffs 2024, Conference Semifinals
The NBA conference finals are set. In the East, the league-leading Boston Celtics will face the Indiana Pacers after defeating the Cleveland Cavaliers. The Pacers advanced by winning against New York Knicks in Game 7. In the West, the Minnesota Timberwolves reached their first conference finals since 2004, overcoming Nikola Jokic and the Denver Nuggets in a thrilling Game 7 comeback.
We closely monitored last weekend's games and Huddle's performance throughout. We paid particular attention to our uptime and pricing data, and now we're excited to share the results.
Uptime Data: Huddle vs Market
In the By The Numbers series, we've emphasized the vital financial impact of uptime for sportsbook operators.
A reliable infrastructure that Huddle offers, ensures that users can place bets, access real-time odds, and engage in live betting without disruptions, that way enhancing customer satisfaction and trust. The impact of higher uptime is magnified during the culmination of the NBA season. Final result: improving user experience and increasing overall revenue for a sportsbook.
Let's break it down:
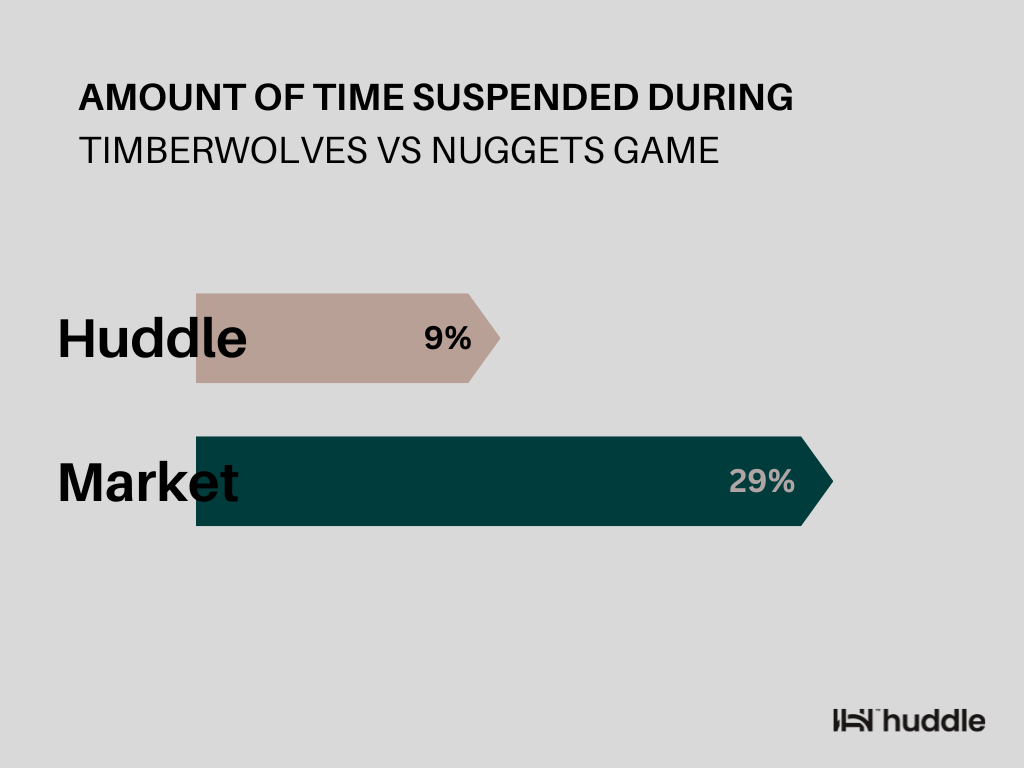
During Friday's game between the Timberwolves and Nuggets, the market (tier 1 operator), had a downtime of over 38 minutes, while Huddle remained at 8 minutes of downtime during the game. Basically Huddle offered an additional 30 minutes of in-play betting. If Huddle continues to sustain its current level of uptime during the upcoming prime time games, the financial impact could be significant for a sportsbook.

To guarantee our market-leading uptime, we have implemented a range of robust measures, including redundancy in critical system components, high-end failover mechanisms, and intelligent load balancing. These efforts ensure that our systems remain resilient and capable of handling any unexpected challenges and these numbers underscore our efforts.
Our data reveals an impressive achievement by Huddle: a remarkable 96% reactivation rate within just 15 seconds, far surpassing the market average of 39%. Over extended durations, we consistently outshine competitors with even higher reactivation rates. Quick market unsuspension and continuous availability are critical elements that we prioritize to ensure seamless services for our users.
Pricing: Huddle vs Market
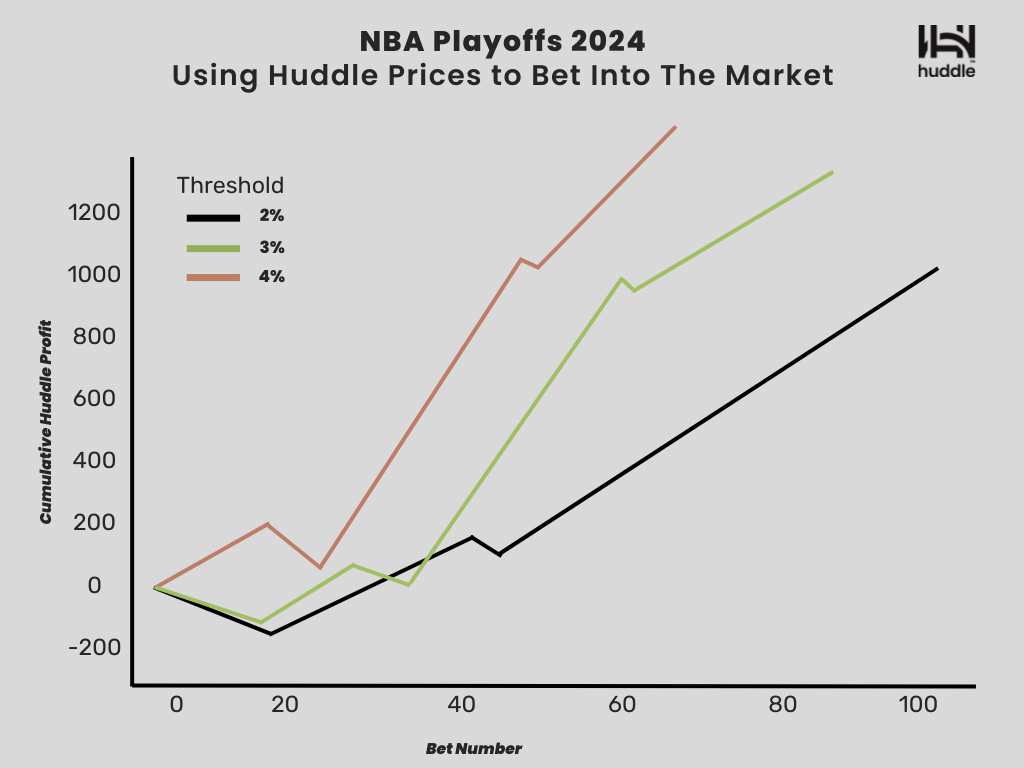
This graph offers an in-depth analysis of Huddle's pricing dominance during the prime-time matchup between the Dallas Mavericks and Oklahoma City Thunder, where we used Huddle prices to bet into the market.
Each data point on the graph represents a $10 bet where Huddle's model significantly deviated from the market's price. For instance, if Huddle placed a $10 bet every time their model had a difference of more than 2% compared to the market, they would have gained a profit of $687 during that particular game.
Furthermore, if the model had a deviation of 3% or more from the market, the profit would have surged to $1078. This illustrates how Huddle's model can enhance pricing accuracy, helping operators increase their margins and avoid being exploited by sharp bettors.
Ultimately, this data shows the potential profit Huddle could have garnered had they opted to utilize their model for betting directly into the market, rather than solely pricing probabilities for their partners who use them to accept bets.
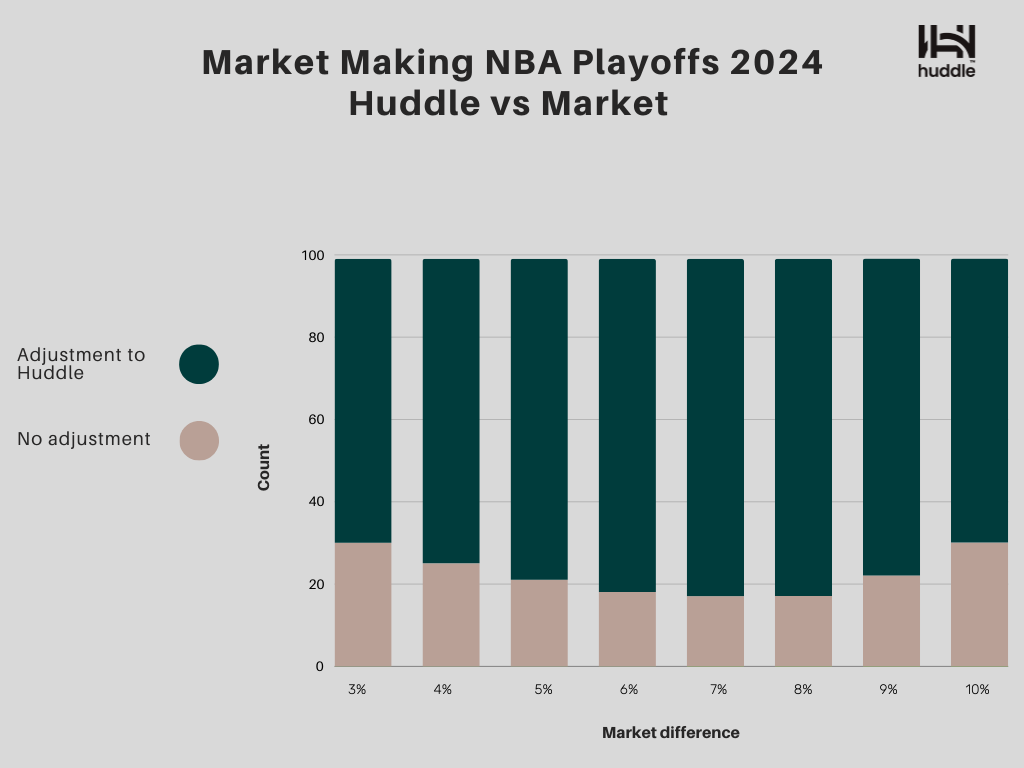
During the weekends game, we analysed in how many instances the market (tier 1 operator) adjusted to Huddle prices. For instance, on multiple occasions the Huddle prices differed from the market by 3%. Impressively, in 69% of these instances, the market adjusted to match Huddle's prices. This underscores Huddle's influence as a market leader in setting prices. The trend remained the same even when the pricing differences were larger - the market ultimately adjusted their prices to Huddle's prices, underscoring the our remarkable market-making prowess.
Subscribe to our Knowledge Hub and get the latest straight to your inbox