By The Numbers: NBA Playoffs 2024, Conference Finals
Blog
June 7, 2024

By The Numbers: NBA Playoffs 2024, Conference Finals
The 2024 NBA Finals are underway with the Boston Celtics hosting the Dallas Mavericks for the first two games. This series promises excitement and fierce competition. With Boston's passionate fans and top players on both teams, it's set to be a memorable showdown.
As the dust settled from the Conference Finals, we dive deep into numbers and Huddle's performance versus the market during these games. We paid particular attention to our uptime and pricing data, and now we're excited to share the results.
Pricing: Huddle vs Market
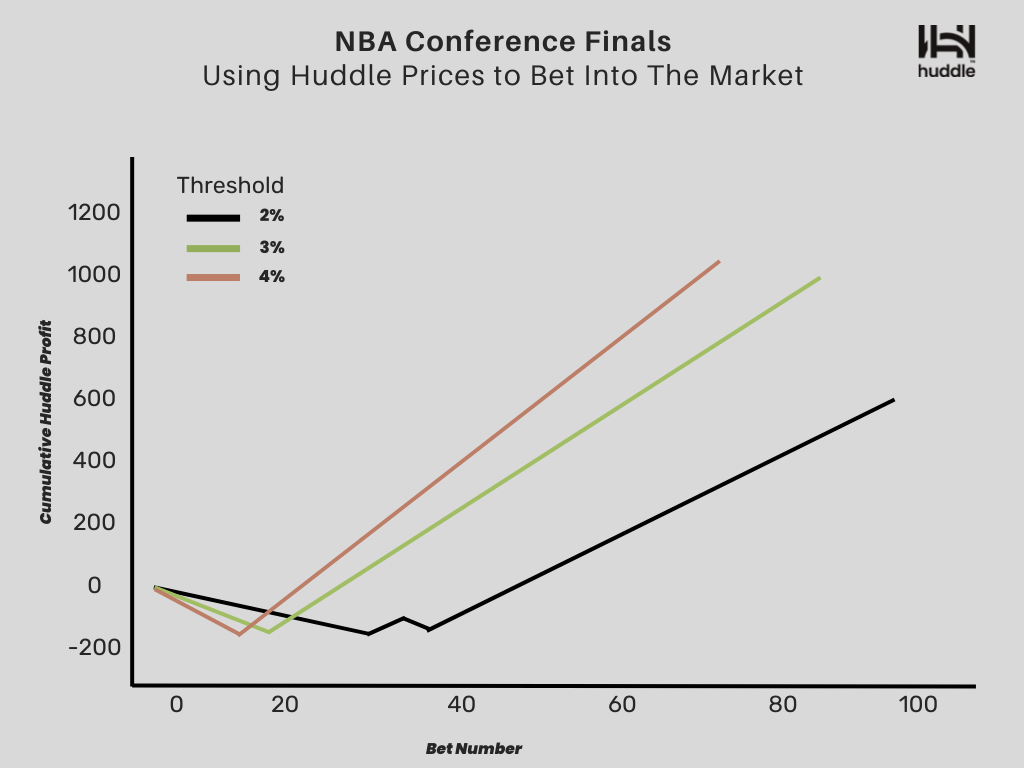
The data above shows the potential profit Huddle could have garnered had they opted to utilize their model for betting directly into the market, rather than solely pricing probabilities for their partners who use them to accept bets during the Pacers vs Celtics game during Conference Finals.
Each point on the graph shows a $10 bet where Huddle's model significantly differed from the market price. For example, if Huddle placed a $10 bet whenever their model deviated by more than 2% from the market, they would have made a profit of $610 in that game.
Moreover, with a deviation of 3% or more, the profit would jump to $999. This demonstrates how Huddle's model improves pricing accuracy, helping operators boost their margins and protect against sharp bettors.
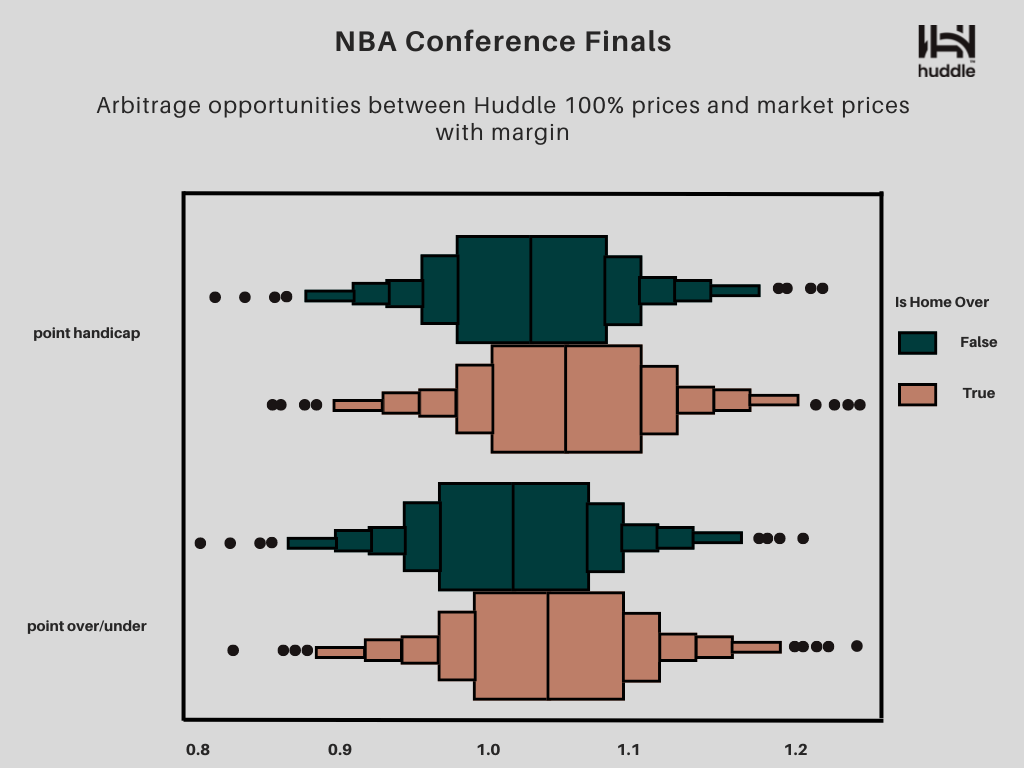
We showcased Huddle's superior prices by describing the discrepancy between Huddle and market (tier 1 operator) prices for NBA in play markets "Total points" and "Spread", in particular arbitrage opportunities.
For each data point in Huddle, we looked for the closest market (tier 1 operator) price in time, considering only prices maximum 120 seconds apart and we listed Huddle's true probability and market observed price.
To explore arbitrage opportunities, we calculated the total book obtained combining Huddle's Home/Over side 100% price and Market (tier 1 operator) Away/Under side price with margin (and conversely). We then described the distribution of these total books, observing the frequency of arbitrages (i.e. "lower than 1" tail of the books distribution).
Conclusion:
- Even without adding margin, Huddle in play prices offer arbitrage with the market only the minority of the times (25.8 %).
- By adding a standard 6% book (splitted 50/50) the chance of an arbitrage falls to 11.9%.
- The behavior doesn't change by side or market.
These numbers show Huddle's unique pricing while not being far off from the market at the same time.
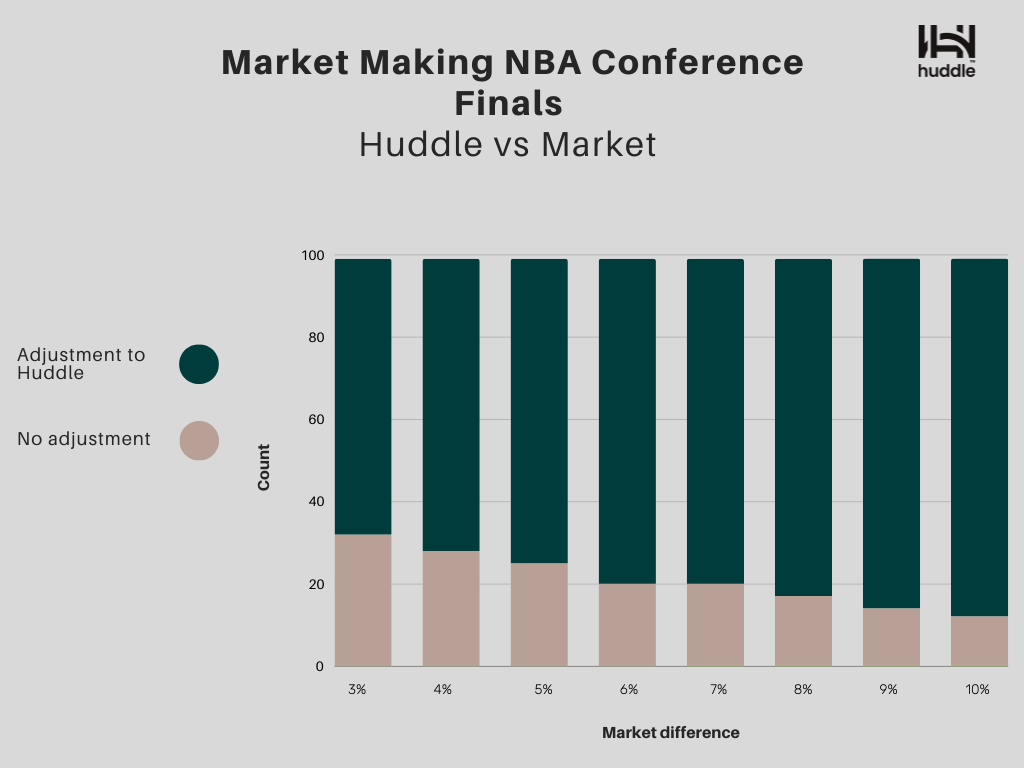
The market (tier 1 operator) usually adjusts to Huddle prices. For instance, on multiple occasions the Huddle prices differed from the market by 3%. Impressively, in 67% of these instances, the market adjusted to match Huddle's prices. This underscores Huddle's influence as a market leader in setting prices.
Uptime Data: Huddle vs Market

In the By The Numbers series, we've emphasize the vital financial impact of uptime for sportsbook operators.
During Celtics vs Pacers game, the market (tier 1 operator), had a downtime of over 32 minutes, while Huddle remained at 6 minutes of downtime during that particular game. Basically Huddle offered an additional 26 minutes of in-play betting. If Huddle continues to sustain its current level of uptime during the upcoming finals games the financial impact could be significant for a sportsbook.
Moreover, our data revealed an impressive achievement by Huddle: a remarkable 96% market reactivation rate within just 15 seconds, far surpassing the market average of 44% (quick market unsuspension and continuous availability are critical elements that we prioritize to ensure seamless services for our users).