By The Numbers: Huddle Performance During Round 1 of NBA Playoffs
Blog
April 25, 2024
By The Numbers: Huddle Performance During Round 1 of NBA Playoffs
As the dust settles on the exciting first week of the NBA playoffs, Huddle delves into it's performance during the Round 1 games. We're keeping tabs on Huddle's playbook throughout the NBA season, uncovering how its strategies and performance dominate the market. Subscribe below and don't miss a beat as we dive deep into Huddle's performance and what it means for the future of sports betting.
Pricing: Huddle vs Market
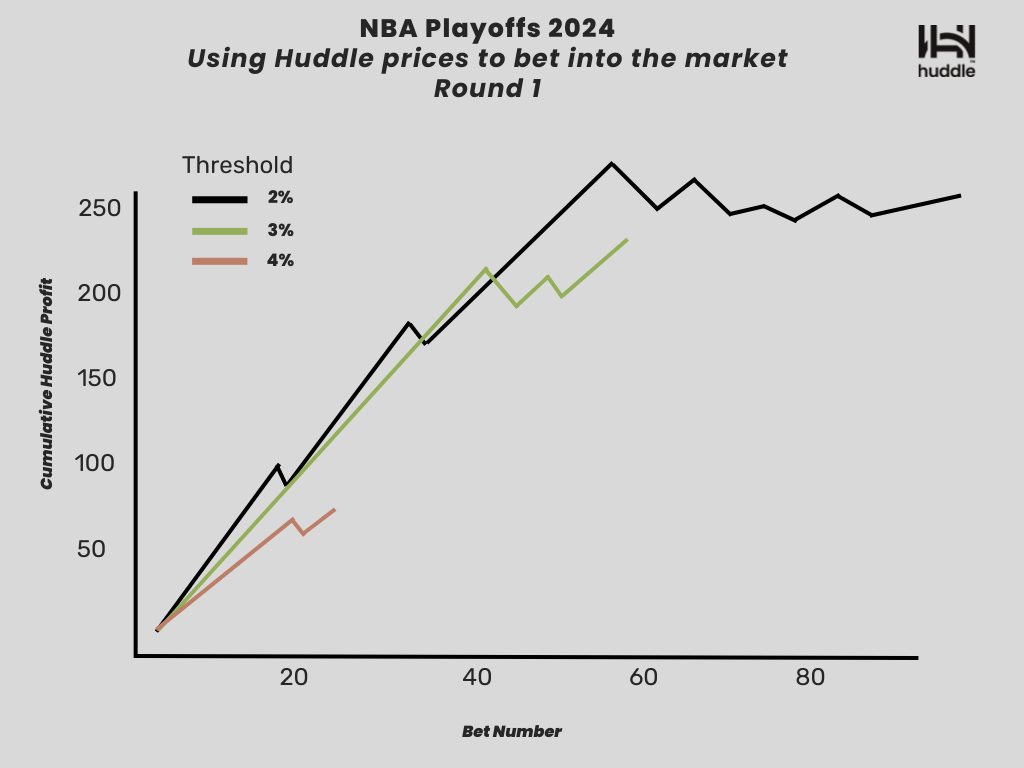
The graph depicts Huddle's potential profit during the Minnesota Timberwolves v Phoenix Suns game, had they opted to utilize their model for betting directly into the market, rather than solely pricing probabilities for their partners who use them to accept bets. Every datapoint represents one $10 bet where Huddle's model was significantly different than market's price. For example, if Huddle placed a $10 bet every time the model had a greater than 2% difference with market, they would have profited $286 during that specific game.
This ultimately means, if an operator utilized Huddle's model for this game, the operator would be benefiting by having superior more accurate pricing helping them deliver as close to the theoretical margin as possible. This showcases how Huddle's model can enhance pricing accuracy, helping operators increase their margins and avoid being exploited by sharp bettors.
To underscore Huddle's significant pricing dominance, we conducted a thorough analysis comparing Huddle's pricing with that of a tier 1 operator in the market during the Round 1 of NBA Playoffs. The goal was to investigate in how many occasions the market adjusted to fall under Huddle pricing when there was a deviation in the price between Huddle and the market (tier 1 operator).
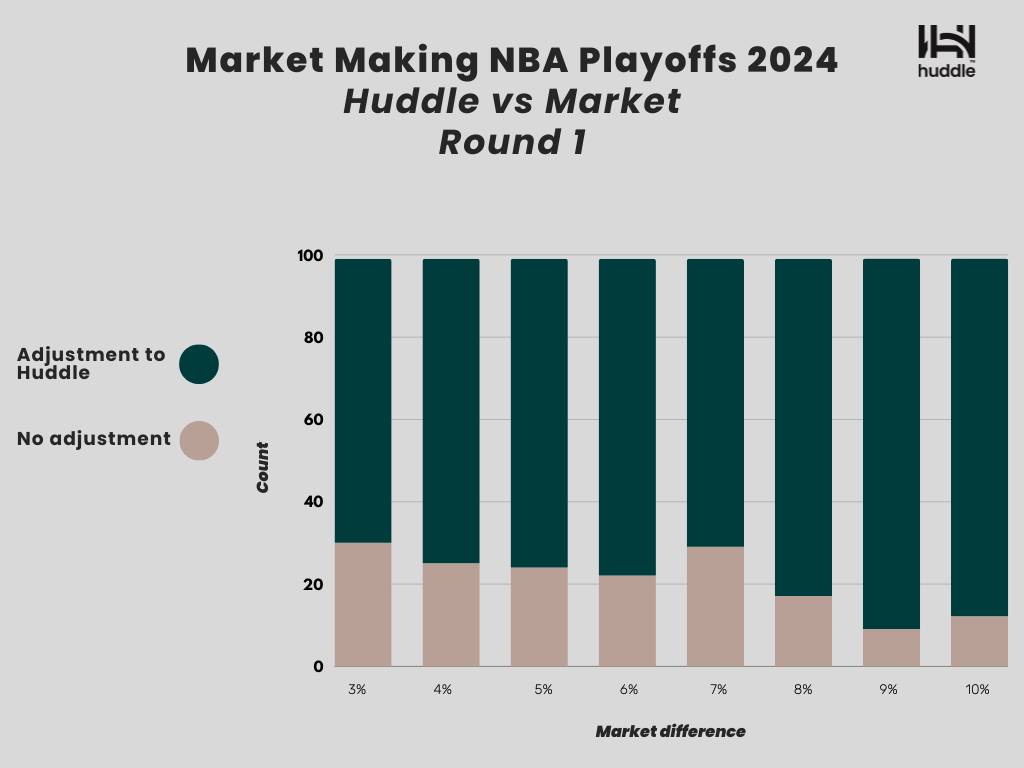
During the NBA Playoffs Round 1 games, Huddle's pricing differed from the market by over 3% in several instances, and in 69% of these cases, the market adjusted to align with Huddle's price. This outcome highlights Huddle's market-making ability and underlines its leading position in pricing.
Market adjustments occurred even when the disparity was more substantial. Notably, when the variance extended to 4%, 5%, 6%, 7%, and beyond, Huddle's influence persisted, with the market ultimately realigning to match Huddle's prices. This trend underscores the remarkable market-making prowess of Huddle and solidifies its dominant position in setting pricing standards within the industry.
Suspension Reactivation Performance: Huddle vs Market
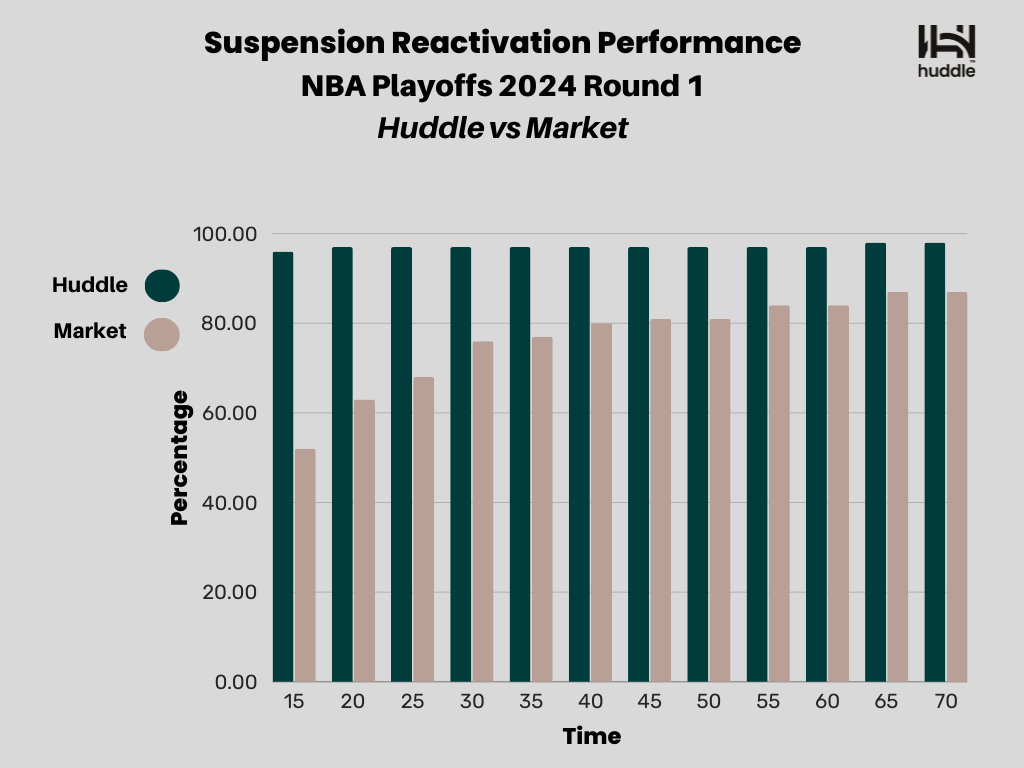
Our data reveals an impressive achievement by Huddle: a remarkable 96% reactivation rate within just 15 seconds, far surpassing the market average of 52%. Furthermore, over extended durations, we consistently outshine competitors with even higher reactivation rates.
A reliable infrastructure that Huddle offers, ensures that users can place bets, access real-time odds, and engage in live betting without disruptions, that way enhancing customer satisfaction and trust. Having consistent high uptime performance is a game-changer for sportsbook operators, every minute counts, leading ultimately to higher turnover for a sportsbook.