Monthly Betting Numbers: NFL Top Markets and Popular Odds
Blog
October 4, 2024

Monthly Betting Numbers: NFL Top Markets and Popular Odds
This analysis delves into the emerging trends and preferences within Same Game Parlay (SGP) betting for the NFL, based on data collected from September 2024. We are examining popular betting markets, the business mix of SGPs, bet size distribution, and price distribution.
The data showcases the dominance of player prop bets, reflecting a shift towards more player-centric betting experiences, as fans are increasingly focused on individual athlete performances. This is a crucial insight for sportsbooks, as it underscores the growing need to offer personalized and dynamic betting options.
Same Game Parlay Market Popularity
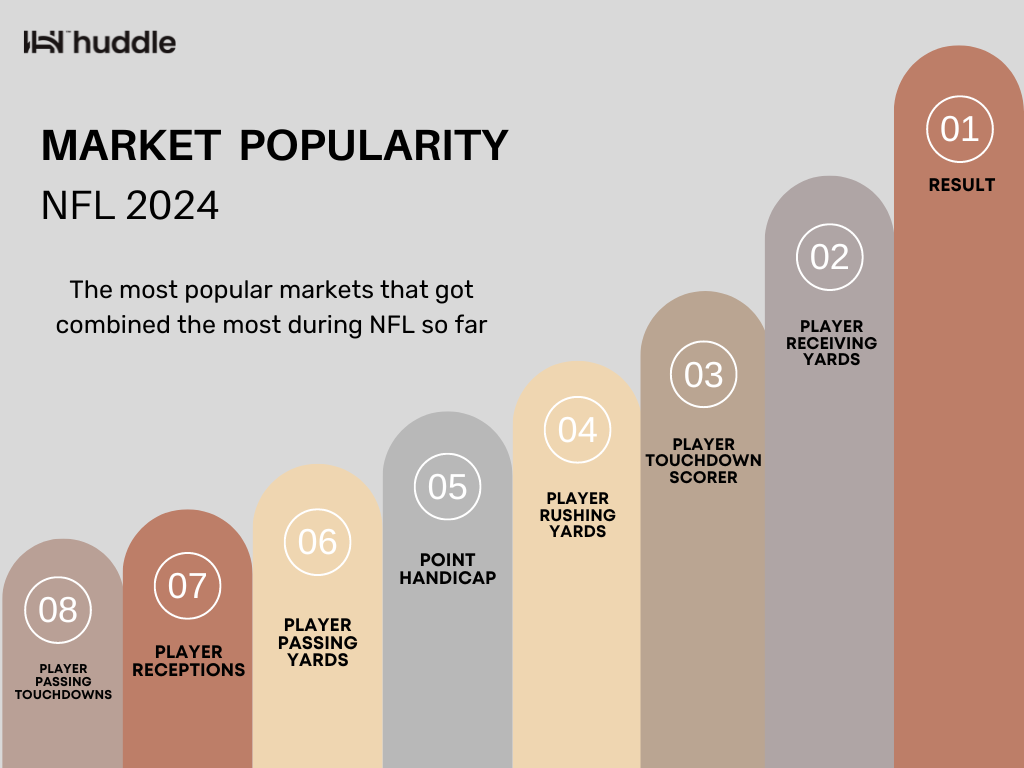
Below graph is a visual representation of the most popular betting markets for the NFL (monthly numbers) that got combined the most. Each oval represents a different type of betting market, ordered by their popularity from most to least.
The graph indicates that the "Result" market, which encompasses bets on the outcome of the game, is the most popular. However, it's notable that player props (proposition bets that focus on player performances in various metrics) dominate the list, making up the majority of the top 8 markets. These include bets on player receiving yards, touchdown scorers, rushing yards, passing yards, receptions, and passing touchdowns. This trend highlights a significant interest in individual player performances as opposed to just the overall game results
Business Mix of The Same Game Parlay
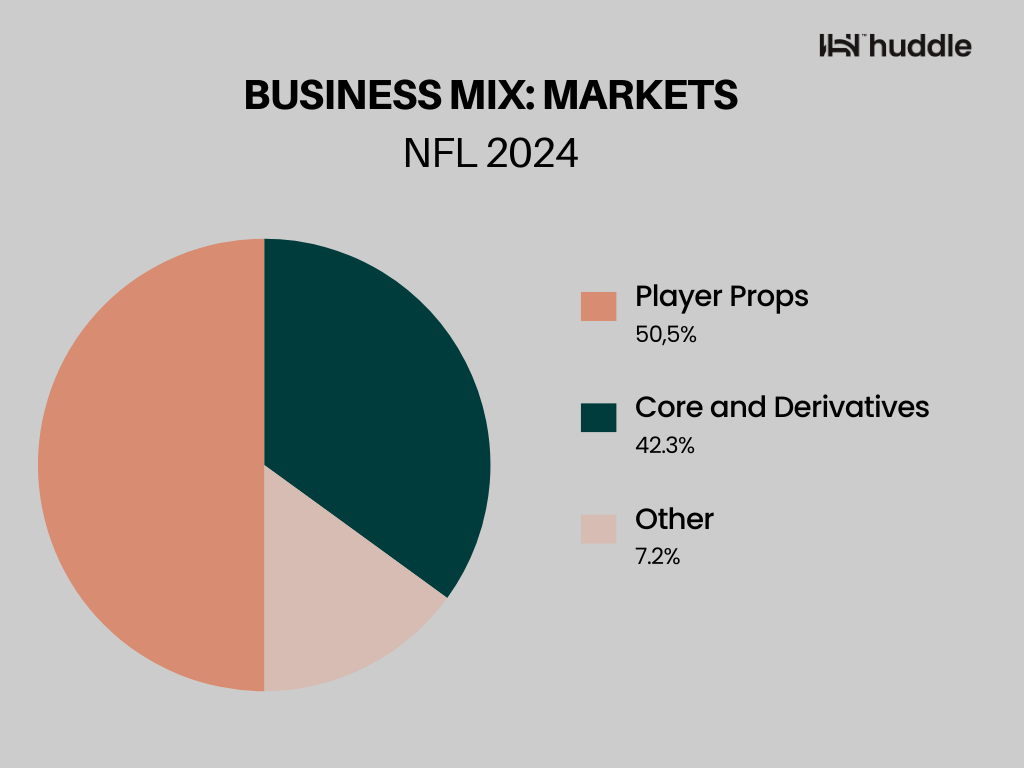
This graph highlights the distribution of bets between Player Props and Core and Derivatives, with Player Props making up the largest share of bets, followed closely by Core and Derivatives.
The prominence of Player Props reflects the trend we saw during the NFL season in September (and last year), where player props were the most combined category in Same Game Parlays (SGPs). This indicates that sportsbooks are shifting their focus toward player-centric markets, which aligns with how fans increasingly engage with sports, focusing more on individual player performances than traditional team-based outcomes.
This trend influences sportsbooks to evolve their offerings, as bettors are seeking more personalized and immediate gratification in their sports betting experience. At Huddle, we've recognized this shift by delivering versatile player markets, driven by the growing interest in the performance of individual athletes. As the nature of sports betting moves in this direction, it's critical for sportsbooks to offer products that can create, price, and settle these markets in real-time, ensuring they stay ahead in this rapidly changing landscape.
Same Game Parlay Size Distribution
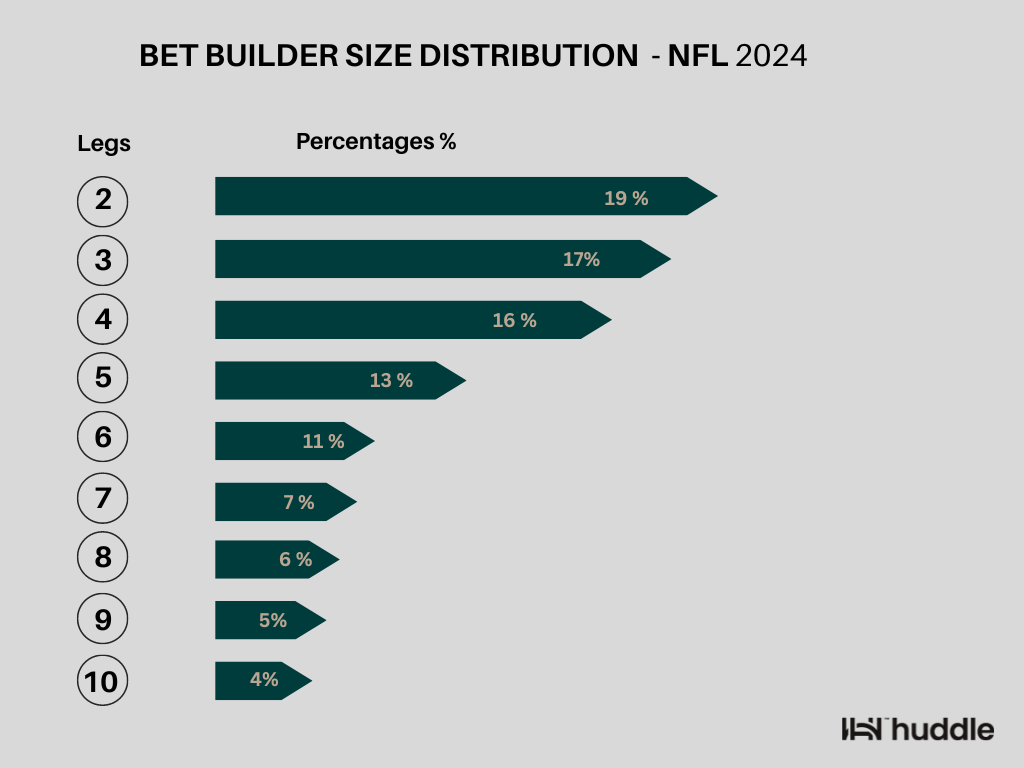
The graph illustrates the distribution of bet sizes in the Bet Builder for the NFL during Septmeber, categorized by the number of legs included in each bet. Each "leg" in a bet represents a separate selection within a combined wager. The data indicates a strong preference among bettors for simpler bets:
- Two-leg bets are the most common, comprising 19% of all Bet Builder bets, suggesting that many bettors prefer combining just two selections.
- Three-leg bets follow closely, accounting for 17% of the bets, indicating a strong preference for slightly more complex bets.
- Four-leg bets make up 16%, and the frequency continues to decline as the number of legs increases.
- Bets with seven to ten legs are less common, with each additional leg attracting fewer bettors. For instance, seven-leg bets account for 7%, decreasing to just 4% for ten-leg bets.
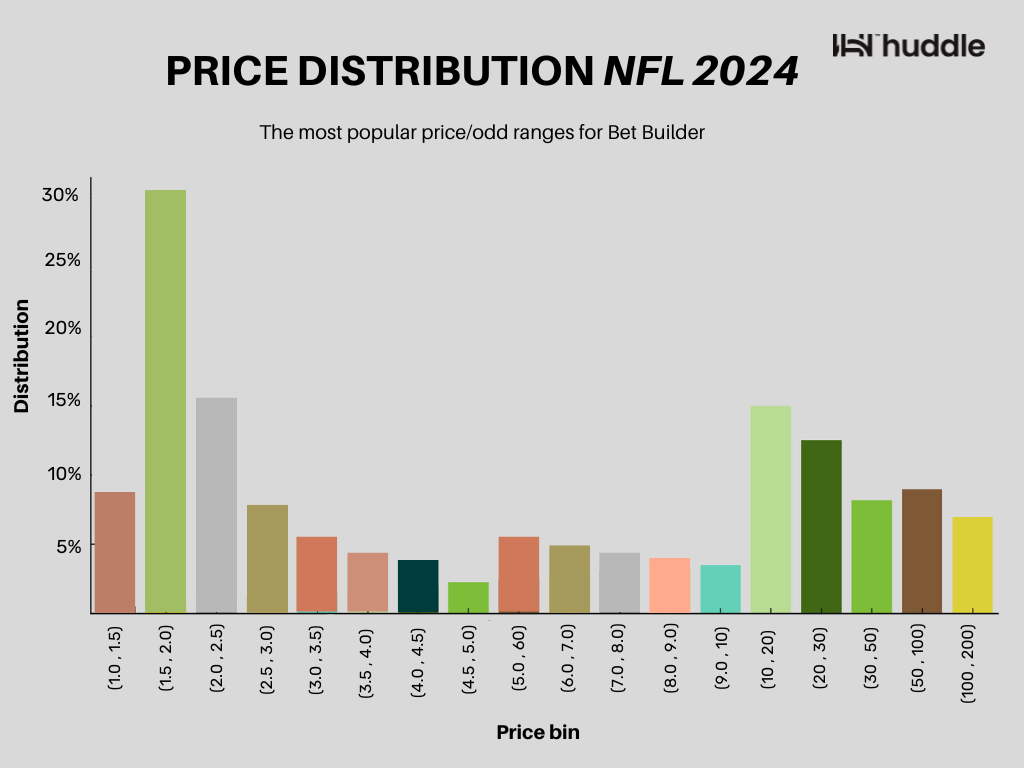
Price Distribution During NFL
This bar chart illustrates the distribution of different price or odds ranges for Bet Builder wagers placed during the NFL 2024 in September. Each bar represents a specific range of odds, and the height of each bar indicates the percentage of bets that fell within that range.
Here's a breakdown of the data:
- The (1.10 - 1.15) range has low representation, suggesting fewer bettors opt for extremely low odds, likely due to the minimal returns.
- The (1.15 - 2.0) range shows a significant jump, especially between (1.15 - 2.0), indicating a strong preference for bets with moderate odds, balancing risk and return.
- The (2.0 - 2.5) range also has a high distribution, highlighting it as a popular choice among bettors.
- From (2.5) onwards, the distribution generally decreases as the odds increase, but with notable peaks at specific intervals:
- (10 - 20)
- (20 - 30)
- (50 - 100)
Subscribe below and get the latest straight to your inbox!